Correlation between Interocular Asymmetry of Corneal Hysteresis and Visual Field Defect in Glaucoma
Article information
Abstract
Purpose
To evaluate the relationship between interocular asymmetries of corneal hysteresis (CH) and visual field defects in Korean patients with glaucoma.
Methods
A total of 444 eyes from 222 participants with glaucoma in at least one eye were enrolled. CH was measured using an ocular response analyzer (Reichert Technologies Inc). Eyes of each participant were classified into “better eye” and “worse eye” based on the mean deviation (MD) value of visual field test. The correlation between interocular differences in intraocular pressure, axial length, central corneal thickness, CH, and MD values was evaluated using Spearman correlation analysis. To exclude the possible effect of antiglaucoma medication on corneal properties, additional analyses were performed on eyes without any glaucoma treatment at the time of CH measurement (treatment-naive group).
Results
Median (interquartile range) MD value was −3.71 dB (−6.87 to −1.30 dB) in the better eye and −10.20 dB (−16.32 to −5.62 dB) in the worse eye. When the correlation between the asymmetry of the MD value and asymmetry of intraocular pressure, axial length, central corneal thickness, and CH were evaluated, only interocular differences in CH were significantly associated with interocular differences in MD values (rho = 0.214, p = 0.001). Among the 222 participants, 60 (27.0%) were treatment-naive group. In these eyes, interocular differences in CH were also significantly associated with interocular differences in the MD values (rho = 0.285, p = 0.029).
Conclusions
The interocular asymmetry of CH was significantly correlated with the interocular asymmetry of visual field defects in glaucoma.
Glaucoma is a progressive optic neuropathy characterized by neuroretinal rim thinning, retinal nerve fiber layer (RNFL) defects, retinal ganglion cell (RGC) loss, and corresponding visual field defects. Intraocular pressure (IOP) is an important parameter responsible for the development and progression of glaucoma. However, other factors, such as blood flow reduction, impaired vascular autoregulation, dysfunctional neurovascular coupling, and corneal properties, are also thought to play a role in the pathogenesis of glaucoma. Regarding corneal properties, central corneal thickness (CCT) [1–4] and corneal hysteresis (CH) [5–18] have been reported to be risk factors for glaucoma. A lower CCT poses a risk for glaucoma progression and has been found to be more prevalent among patients with severer glaucomatous damage [1–4]. CH is a dynamic biomechanical property of the cornea that measures its ability to resist deformation. Previous studies have reported that CH was lower in eyes with glaucoma than in normal eyes, and lower CH was associated with structural and functional progression of glaucoma [5–18]. A possible method to investigate the effect of CH on the development and progression of glaucoma is to evaluate the correlation between interocular differences in CH and the severity and progression rate of glaucoma in both eyes of the same patient. According to previous studies, the difference in CH between both eyes is correlated with interocular differences in glaucoma severity [19] and progression rate [20]. Studies have reported differences in characteristics of glaucoma among different ethnicities [21,22]; however, to date, little has been reported regarding Korean patients. This study aimed to investigate the relationship between interocular asymmetry of CH and visual field defects in Korean patients with glaucoma.
Materials and Methods
Ethical statements
This retrospective observational study was approved by the Institutional Review Board of Kim’s Eye Hospital (No. 2020-08-015-002). All the procedures conformed to the guidelines of the Declaration of Helsinki. The requirement for informed consent was waived due to the retrospective nature of the study.
Study design
Participants who underwent CH measurements in both eyes and had glaucoma in at least one eye were included in the study. All eyes underwent detailed ophthalmic examinations, including measurement of refractive error, visual acuity, and IOP using a Goldmann applanation tonometer, slit-lamp biomicroscopic examination, fundus photography, CCT measurement using ultrasound pachymetry (SP-3000, Tomey Corp), axial length (AL) measurement using partial coherence interferometry (IOLMaster, Carl Zeiss Meditec), and automated visual field test using a Humphrey Field Analyzer (Carl Zeiss Meditec) with the Swedish interactive thresholding algorithm. Visual fields with fixation losses and false-positive and false-negative response rates <20% were considered reliable.
The inclusion criteria were as follows: age ≥18 years, a best-corrected visual acuity of 20 / 40 or better, a normal anterior segment on slit-lamp examination, optic nerve head with glaucomatous changes (i.e., an increased cup to disc ratio and neuroretinal rim narrowing), and an RNFL defect on fundus photography in at least one eye. Only patients with primary open-angle glaucoma, including normal-tension glaucoma, were enrolled in this study. Eyes with narrow-angle or secondary glaucoma (uveitic, neovascular, traumatic, drug-induced), any retinal disease, neurological disease, or history of intraocular surgery or laser treatment were excluded. Level of IOP or severity of glaucoma was not limited.
Corneal hysteresis measurement
CH was measured using an ocular response analyzer (ORA; Reichert Technologies Inc) as described previously [5–18]. The ORA is based on noncontact tonometer technology, which uses an air jet to apply force to the cornea and an electro-optical system to determine applanation. As the cornea moves inward and outward in response to the increasing and decreasing velocities of the air jet, its deformation is tracked by an electro-optical system. Inward and outward applanation events were identified based on the peak amplitude of the reflected light hitting the photodetector. Pressure values were recorded in the inward (P1) and outward (P2) applanation states. The difference between P1 and P2 is termed CH, which is given in mmHg.
Statistical analyses
The eyes of the participants were classified into “better eye” and “worse eye” based on the mean deviation (MD) value of visual field test: an eye with a greater MD value was defined as a “better eye.” The asymmetry between eyes was calculated by subtracting the value of worse eye from the value of better eye. The normality of the variables was tested using the Kolmogorov-Smirnov test. Variables with a normal distribution are presented as mean ± standard deviation, and variables without a normal distribution are presented as median and interquartile range. Values of better eye and worse eye were compared using the paired t-test or Wilcoxon signed-rank test. Interocular differences in IOP, refractive error presented as spherical equivalent (SE), AL, CCT, CH, and MD did not show a normal distribution. Therefore, the correlation between interocular differences in IOP, SE, AL, CCT, CH, and MD was evaluated using Spearman correlation analysis. To exclude the possible effect of antiglaucoma medication on corneal properties, additional analyses were performed on eyes without any glaucoma treatment at the time of CH measurement (treatment-naive group).
The participants were subdivided into symmetric (interocular MD value difference <3 dB) and asymmetric groups (interocular MD value difference ≥3 dB) [23]. Interocular differences in IOP, SE, AL, CCT, CH, and MD values between the two groups were compared using the Mann-Whitney U-test. The threshold for statistical significance was set at p < 0.05. Statistical analyses were performed using IBM SPSS ver. 26.0 (IBM Corp).
Results
A total of 444 eyes from 222 participants (118 female and 104 male) were enrolled. The mean age was 53.3 ± 14.3 years, and all participants were Korean. The mean values of the IOP, SE, and AL in the better and worse eyes were 16.27 ± 4.38 and 16.35 ± 4.57 mmHg, −2.18 ± 3.27 and −2.29 ± 3.47 diopters, and 24.86 ± 1.75 and 24.91 ± 1.92 mm, respectively (Table 1). Median (interquartile range) MD value was −3.71 dB (−6.87 to −1.30 dB) in the better eye and −10.20 dB (−16.32 to −5.62 dB) in the worse eye. When IOP, SE, and AL of better and worse eyes were compared, no significant difference was found (p > 0.05) (Table 1). The worse eye had a greater number of antiglaucoma medications compared to the better eye (1.31 ± 1.03 vs. 1.06 ± 1.03, p = 0.012).
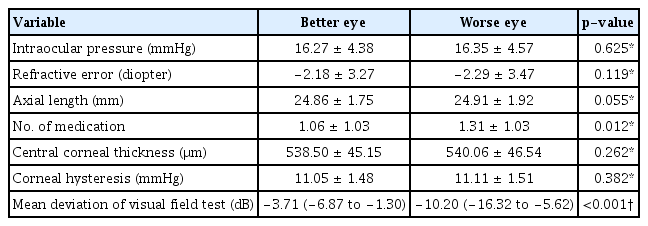
Clinical characteristics of eyes of the same patient classified as better and worse eyes based on visual field mean deviation values (n = 222)
Regarding corneal parameters, mean CCT and CH of better and worse eyes was 538.50 ± 45.15 and 540.06 ± 46.54 μm, and 11.05 ± 1.48 and 11.11 ± 1.51 mmHg, respectively (Table 1). On comparison, these variables were not significantly different between the two groups (p > 0.05).
The distributions of interocular differences in IOP, CCT, CH, and MD values of the visual field are presented in Fig. 1A and 1B. When the correlation between the asymmetry of the MD value of the visual field and asymmetry of IOP, SE, AL, CCT, and CH were evaluated, only interocular differences in CH were significantly associated with interocular differences in MD values of the visual field (rho = 0.214, p = 0.001) (Table 2 and Fig. 2A, 2B).

Distribution of interocular differences (better eye – worse eye) in (A) intraocular pressure, (B) central corneal thickness, (C) corneal hysteresis, and (D) mean deviation of visual field. Data obtained for these parameters did not show normal distribution.
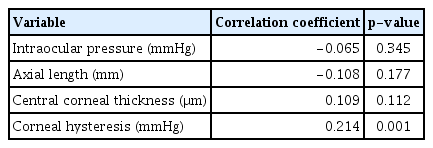
Spearman correlation coefficient between asymmetry of visual field mean deviation and asymmetry of other clinical characteristics (n = 222)
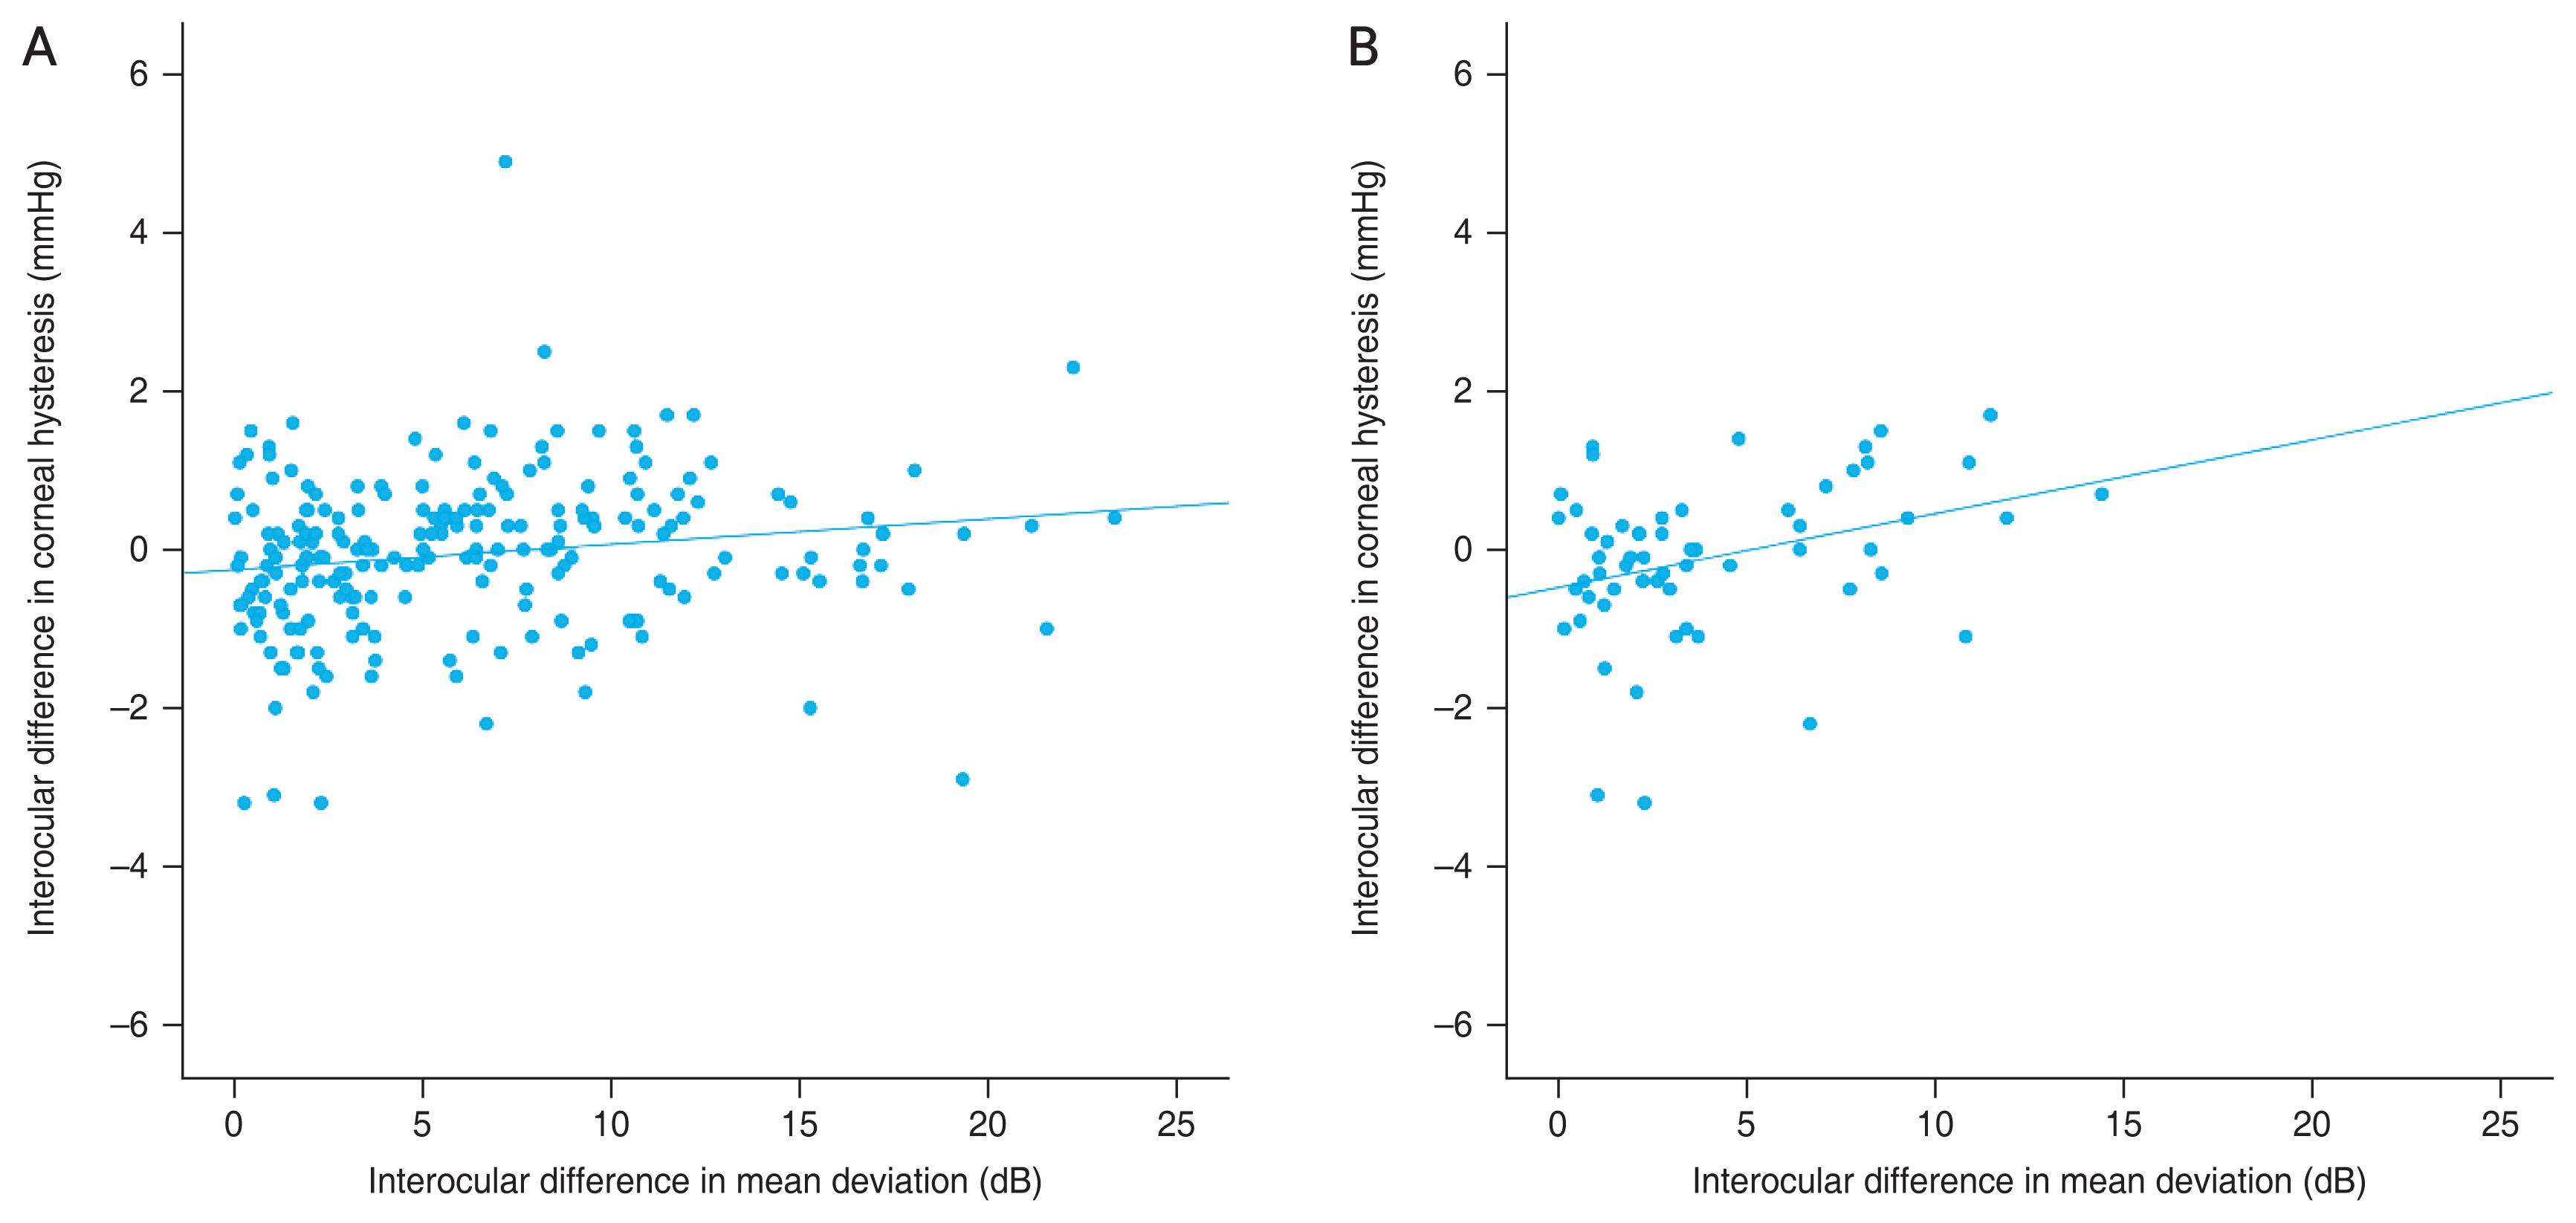
Scatterplot presenting the relationship between asymmetry (better eye – worse eye) of visual field mean deviation and asymmetry of corneal hysteresis in (A) all eyes (rho = 0.214, p = 0.001) and (B) eyes of treatment-naive group (rho = 0.284, p = 0.029). A significant correlation was found between interocular asymmetry of corneal hysteresis and visual field defect.
Among the 222 participants, 60 (27.0%) were treatment-naive group. In these eyes, no significant interocular differences were found in IOP, SE, AL, CCT, or CH (p > 0.05) (Table 3). Interocular differences in CH were significantly associated with interocular differences in the MD values of the visual field (rho = 0.285, p = 0.029) (Table 4 and Fig. 2); other factors did not show a significant correlation (p > 0.05).
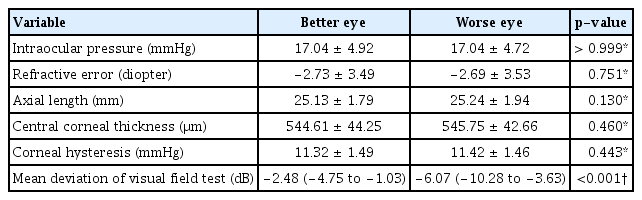
Clinical characteristics of eyes of the same patient classified as better and worse eyes based on visual field mean deviation values for the treatment-naive group (n = 60)

Spearman correlation coefficient between asymmetry of visual field mean deviation and asymmetry of other clinical characteristics for the treatment-naive group (n = 60)
Among the 222 participants, 80 (36.0%) were in the symmetric group and 142 (64.0%) were in the asymmetric group. When interocular differences in IOP, SE, AL, CCT, CH, and MD values between the two groups were compared, the asymmetric group showed a greater asymmetry in CH, number of medications, and visual field MD (p < 0.05) (Table 5). Spearman correlation coefficient for the CH and MD interocular differences was −0.020 (p = 0.862) for the symmetric group and 0.083 (p = 0.326) for the asymmetric group.

Comparison of interocular differences (better eye – worse eye) between symmetric and asymmetric glaucoma groups
Discussion
In the present study, we observed that interocular asymmetry of CH was significantly correlated with interocular asymmetry of visual field defects in glaucoma. Among the two eyes of a patient, the eye with a lower CH showed a worse visual field defect. This finding suggests that a lower CH may be a risk factor for a worse visual field defect.
CH, a biomechanical property of the cornea related to viscous damping, has been indicated as a predictive factor for the development and progression of glaucoma [5–20]. The ability of the cornea to resist deformation may reflect the constitution of its extracellular matrix. This could be related to the extracellular matrix composition of posterior ocular tissues related to glaucomatous damage, such as the lamina cribrosa and peripapillary sclera [8,11]. To verify this hypothesis, various studies have investigated the correlation between CH and glaucoma by comparing the characteristics of patients with various conditions, and found a significant association between lower CH a nd a higher prevalence, greater severity, or faster glaucoma progression [5–20].
When evaluating the effect of ocular factors on disease, comparing the characteristics between the two eyes of the same patient may be useful for excluding the confounding effect of interindividual factors. In this context, several studies have evaluated the correlation between interocular asymmetry of various factors and glaucoma [24–26]. Regarding the interocular asymmetry of CH, Estrela et al. [20] investigated the relationship between asymmetries of CH and rate of visual field progression in glaucoma patients and found that asymmetry of CH was significantly associated with the asymmetry in visual field change rate. However, the asymmetry of CCT and IOP did not show a significant effect. In addition, Anand et al. [19] reported that asymmetric visual field defects were associated with asymmetric CH but not with CCT and IOP. In the present study, interocular differences in CH were significantly associated with interocular differences in visual field defect severity, which agrees with the results of previous studies. The interocular asymmetry of CCT, IOP, and AL was not significantly correlated with the interocular asymmetry of visual field defects. This finding suggests that among the two eyes of a patient, a lower CH may be a risk factor for a worse visual field defect. Despite the statistical significance, the relatively small correlation coefficient for the overall group analysis (0.214) and treatment-naive subgroup analysis (0.285), and the insignificant correlation for the asymmetric subgroup analysis imply that the correlation between the asymmetries of CH and MD may not be strong.
When the cutoff value of 3 dB interocular difference was applied (symmetric vs. asymmetric groups), the interocular difference in CH was −0.3 mmHg in the symmetric group and 0.2 mmHg in the asymmetric group. This implies that in eyes with an interocular difference of <3 dB, the better eye had a lower CH. Among the 80 eyes with symmetric group, 57 eyes (71.3%) had an interocular difference of CH <1 mmHg, which is less than the measurement variability level. Therefore, we believe that this may have occurred incidentally.
It is well known that a high IOP is an important risk factor for glaucoma. However, in the present study, interocular asymmetry of IOP did not show a significant effect, similar to the results of previous studies [19,20]. This may be explained by the small amount of IOP interocular asymmetry (mean difference of <1 mmHg between the better and worse eyes) in the study population. The inclusion of eyes with a lower interocular IOP difference may have a lesser effect on the interocular asymmetry of glaucoma. Another possible factor is the effect of IOP-lowering medication. In the present study, worse eyes used more IOP-lowering medications. Therefore, the interocular asymmetry of IOP may decrease during treatment, which may induce a weaker correlation between interocular asymmetry of IOP and glaucoma.
It has been reported that the IOP-lowering medication induces an increase in CH [27]. To evaluate this effect, subgroup analyses were performed on treatment-naive patients, and similar results were found for those treated with IOP-lowering medications. This suggests that CH may provide further information even when IOP is symmetric or after escalation of IOP-lowering treatment.
In this study, multivariate analysis was not possible because the variables of intereye differences did not show a normal distribution. According to a previous study, the visual field test showed a normal distribution after logarithmic transformation [20]. However, even with logarithmic transformation, the variables did not show a normal distribution and statistical analyses using logarithmic-transformed variables showed similar results. Therefore, the results with logarithmic transformation are not presented.
In the present study, only the IOP at the time of CH measurement was analyzed. A more detailed analysis of IOP, including peak, fluctuation, or through-level, may provide more information. The difference in IOP and MD values ranged up to 13 mmHg and 23.34 dB, respectively. Only patients with primary open-angle glaucoma, including normal-tension glaucoma, were enrolled in this study. Patients with a narrow-angle and secondary glaucoma (uveitic, neovascular, traumatic, drug-induced) were excluded. Although detailed ophthalmic examination was performed, the presence of pseudoexfoliation materials, signs of mild inflammation, or a previous history of IOP elevation may have been missed. This may have contributed to the highly asymmetric glaucoma in this study.
It has been reported that lower CH is significantly associated with faster rates of RNFL loss over time [7,14] and lower corneal hysteresis is associated with deeper anterior lamina depth and anterior displacement of the lamina cribrosa following surgical and medical IOP reduction [8,11]. In this study, only interocular asymmetry of the visual field was evaluated. Other structural parameters, such as RNFL or RGC thicknesses, or optic nerve head parameters measured by optical coherence tomography, were not evaluated. In addition, because this was a cross-sectional study, the effect of CH asymmetry on glaucoma progression was not investigated. Several studies have evaluated Korean patients regarding the glaucoma diagnostic ability of CH [17], effect of CH on glaucoma progression [18], and changes in CH after IOP-lowering medication [16]. However, to date, little has been reported on the correlation between asymmetry of CH and visual field defects in Korean patients. We believe that the results of this study may provide useful information for clinical practice. Further longitudinal studies involving various structural parameters in Korean patients are required.
In conclusion, interocular asymmetry of CH was significantly correlated with interocular asymmetry of visual field defects in glaucoma, even when IOP and CCT were not significantly associated. When investigating both eyes of a patient, further caution may be needed for eyes with a lower CH.
Acknowledgements
None.
Notes
Conflicts of Interest: None.
Funding: None.