Chemokine Expression during Adipogenesis and Inflammation in Orbital Fibroblasts from Patients with Graves' Orbitopathy
Article information
Abstract
Purpose
Chemokines are involved in the pathogenesis of various autoimmune diseases, including Graves' orbitopathy (GO), but comprehensive analyses of the dynamics of these cytokines and their receptors in such diseases remain lacking. In this study, we investigated the expressions of chemokines and their receptors during adipogenesis and inflammation in primary cultured orbital fibroblasts from patients with GO.
Methods
The messenger RNA (mRNA) expression levels of chemokines were compared between GO (n = 6) and non-GO (n = 5) orbital tissues by real-time polymerase chain reaction. After adipogenesis was induced in primary cultured orbital fibroblasts from patients with GO (n =5) and following stimulation with interleukin (IL)-1β and tumor necrosis factor (TNF)-α, the mRNA expression levels of chemokines and their receptors were analyzed.
Results
Chemokines were significantly downregulated in GO orbital tissues compared to non-GO orbital tissues (p < 0.05). Adipogenesis resulted in a strong increase in mRNA expression levels of chemokines and their receptors at an early stage (day 1); however, expression levels started to decrease thereafter and, eventually, decreased to below basal levels at the end of adipogenesis (day 10). Following stimulation with IL-1β and TNF-α, the mRNA expression levels of chemokines and their receptors increased, showing different responses to various proinflammatory cytokines.
Conclusions
Chemokines were strongly upregulated in the early phase of adipogenesis before decreasing continuously until the end of adipogenesis. Also, overt mature GO tissues showed reduced mRNA expression of chemokines compared to controls, which might indicate the existence of a shorter window for effective medical inflammatory treatment. The heightened levels of chemokines and their receptors observed after stimulation with IL-1β and TNF-α suggest a crucial role of proinflammatory cytokines in the pathogenesis of GO and, further, support the idea that chemokines could be used as biomarkers of GO activity.
Graves' orbitopathy (GO) is an autoreactive inflammatory disease that causes expansion of orbital adipose tissue and edema of extraocular muscles within the orbit [123]. Generation of antibodies against self-antigens such as thyroid-stimulating hormone receptor and insulin-like growth factor-1 receptor, inflammatory infiltration, and accumulation of glycosaminoglycans lead to infiltrative changes in periocular tissues. Interactions between orbital fibroblasts and self-reactive lymphocytes drive orbital fibroblasts to proliferate or differentiate into adipocytes [123].
Chemokines are small proteins that induce chemotactic migration of leukocytes during immune and inflammatory reactions [4]. Several studies have indicated that there is a relationship between chemokines and GO. Expression levels of C-C chemokine ligand (CCL) 2, C-X-C chemokine ligand (CXCL) 9, CXCL10, and CXCL11 in GO orbital fibroblasts are increased by interferon-γ and tumor necrosis factor (TNF)-α [56]. Increased serum concentrations of CXCL9 and CXCL10 partially reflect orbital inflammation [7]. These results suggest that the expression patterns of other chemokines and their receptors under inflammatory conditions should be investigated in primary cultured GO orbital fibroblasts. Adipogenesis is also an important mechanism in the pathogenesis of GO. The chemokine network during adipogenesis in 3T3-L1 cells as well as dominant chemokines in preadipocytes, adipocytes, or both have been evaluated [8]. However, studies on the expression levels of chemokines in GO orbital fibroblasts during adipogenesis are lacking.
In this study, we compared the basal messenger RNA (mRNA) expression levels of chemokines in GO and non-GO orbital tissues. We also investigated changes in the mRNA expression levels of chemokines at different time points during adipogenesis and inflammatory reactions to understand the pathogenesis of GO and suggest therapeutic strategies.
Materials and Methods
Reagents
Recombinant human interleukin (IL)-1β and TNF-α were purchased from R&D Systems (Minneapolis, MN, USA). Dulbecco's modified Eagle's medium/nutrient mixture F-12 (DMEM/F-12), DMEM, and penicillin–streptomycin were purchased from Welgene (Daegu, Korea). Fetal bovine serum (FBS) was purchased from Invitrogen (Carlsbad, CA, USA).
Subjects and preparation of tissues and cells
Orbital tissue specimens were collected from patients with severe, inactive GO during orbital decompression surgery (n = 6). At the time of surgery, patients with GO were in the euthyroid state and had not received steroids or radiation therapy for at least three months. Patient characteristics are summarized in Table 1. The mean duration of GO before surgery was 2.03 years (range, 1.5–2.4 years). Non-GO tissue specimens were collected from age- and sex-matched control subjects with no history of autoimmune thyroid d iseases d uring o rbital surgery for other noninflammatory diseases (total n = 5, including n = 2 orbital fracture surgeries and n = 3 eviscerations). Three patients had received steroid treatment at least three months before decompression, and none of the patients had undergone radiation in the past. The protocol for obtaining orbital adipose/connective tissue samples from patients and controls was approved by the Institutional Review Board of Severance Hospital, and written informed consent was obtained from all patients and controls. This research adhered to the tenets of the Declaration of Helsinki.
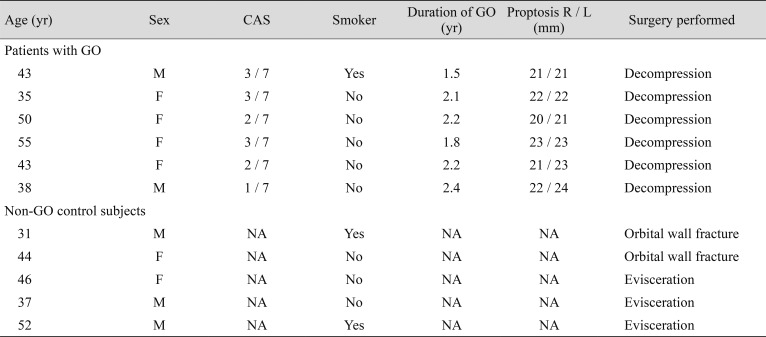
Clinical information for patient samples
Orbital tissues were homogenized using a tissue homogenizer (Precellys 24; Bertin Instruments, Montigny-le-Bretonneux, France) and a Precellys Lysing Kit (Bertin Instruments) with TRIzol (Invitrogen). Total RNA contents were determined using a NanoDrop spectrophotometer (Thermo Fisher Scientific, Waltham, MA, USA).
For orbital fibroblast analysis, specimens were primarily cultured as previously described [9]. Briefly, minced tissue was suspended in DMEM/F-12 containing 20% FBS and penicillin–streptomycin. After growth of fibroblasts, cells were passaged using trypsin/ethylenediaminetetraacetic acid. The cells were then incubated in DMEM/F-12 containing 10% FBS and antibiotics. Cells from passages 2 to 5 were used for subsequent experiments. The orbital fibroblasts were grown to confluence in six-well plates, and the culture medium was changed to serum-free DMEM/F-12, followed by incubation with 10 ng/mL of IL-1β or TNF-α.
To study the time course of adipogenesis, cells were cultured and differentiated into adipocytes using the following protocol. The culture medium was changed to serum-free DMEM supplemented wit h 100 µM of isobutylmethylxanthine (Sigma-Aldrich, St. Louis, MO, USA), 10 µM of dexamethasone (Sigma-Aldrich), 1 µM of insulin (Roche Holding, Basel, Switzerland), 33 µM of biotin (Sigma-Aldrich), 17 µM of pantothenic acid (Sigma-Aldrich), 10 µg/mL of transferrin (Sigma-Aldrich), 0.2 µM of T3 (Sigma-Aldrich), 0.2 µM of carba-prostaglandin (Sigma-Aldrich), and 10 µM of rosiglitazone (Santa Cruz Biotechnology, Dallas, TX, USA). Differentiation was continued for 10 days, during which the medium was replaced every two or three days. Chemokine mRNA levels were analyzed at one, three, five, seven, and 10 days of adipogenesis, and differentiating medium was added or replaced at the same time. To verify adipogenesis, cells were stained with oil red O on days 0 and 10. Six milliliters of a stock solution prepared with 0.5% oil red O in isopropanol was mixed with 4 mL of distilled water and left at room temperature for one hour. The solution was then filtered and added to cells that had been washed with phosphate-buffered saline and fixed with 3.7% formalin for one hour at 4℃. The cell-oil red O solution mixture was left for one hour at room temperature, inspected using a light microscope (Axiovert; Carl Zeiss AG, Oberkochen, Germany), and photographed (Olympus BX60; Olympus Corp., Melville, NY, USA) (×40).
Real-time polymerase chain reaction
Total RNA was isolated using TRIzol. One microgram of RNA was used for first-strand complementary DNA synthesis according to the manufacturer's instructions (SensiFAST cDNA Synthesis Kit; Meridian Life Science, Memphis, TN, USA). mRNA levels were measured by real-time polymerase chain reaction using the LightCycler 480 System (Roche Holding) with SYBR Green PCR Master Mix (Takara Bio, Shiga, Japan) and Realtime PCR Master Mix (TOYOBO, Osaka, Japan). The TaqMan Gene Expression Assay (Applied Biosystems, Foster City, CA, USA) was used for CXCL16 (assay identification no. Hs00222859_m1).
All PCRs were performed in triplicate, and the housekeeping gene GAPDH was used for normalization. Primer sequences are shown in Table 2. The results are expressed as fold-change of the threshold cycle (Ct) value relative to that in the control group using the 2−ΔΔCt method [10].
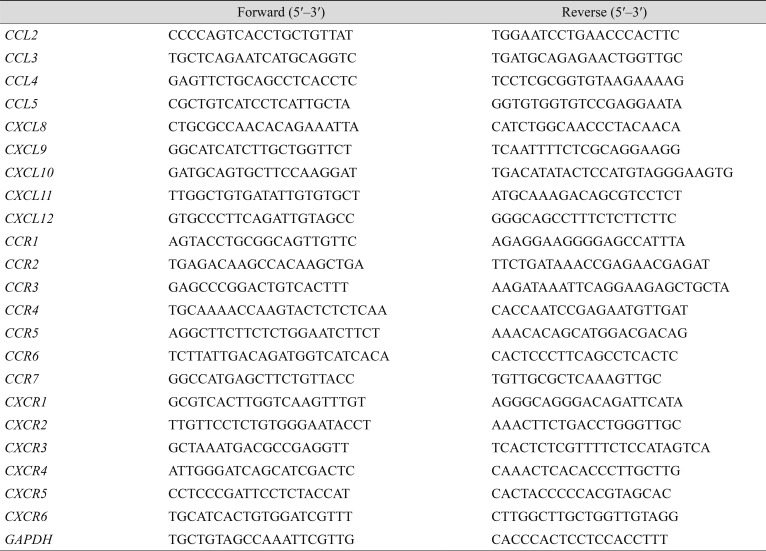
Primer sequences (SYBR) used in this study
Statistical analyses
IBM SPSS Statistics ver. 20.0 (IBM Corp., Armonk, NY, USA) was used for statistical analyses. All experiments were performed at least three times using samples from different patients, with results expressed as mean ± standard deviation (SD). Comparisons of data between groups or within cell groups were analyzed by t-test or one-way analysis of variance. A p-value less than 0.05 indicated statistical significance.
Results
Chemokines are downregulated in GO orbital tissues relative to in non-GO orbital tissues
We compared the basal mRNA expression levels of chemokines and their receptors in GO (n = 6) and non-GO (n = 5) orbital tissues. CCL2, CCL3, CCL4, CCL5, CXCL9, CXCL10, CXCL11, and CXCL12 mRNA expression levels were significantly lower in GO orbital tissues than in non-GO orbital tissues (Fig. 1A). Results for chemokine receptors varied. There were no significant differences in mRNA expression levels of most chemokine receptors; however, C-C chemokine receptor (CCR) 1 a nd C-X-C chemokine receptor (CXCR) 4 were significantly downregulated in GO orbital tissues, while CCR6 and CXCR3 were upregulated in GO orbital tissues (Fig. 1B).
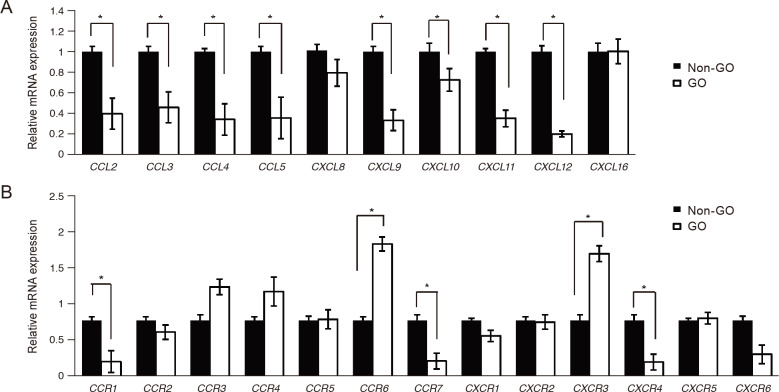
Expressions of chemokines and their receptors in Graves' orbitopathy (GO) and non-GO orbital tissues. Messenger RNA (mRNA) expression levels of (A) all chemokines and (B) chemokine receptors were evaluated in GO (n = 6) and non-GO (n = 5) orbital tissues by real-time polymerase chain reaction. Chemokines were significantly downregulated in GO cells compared to non-GO cells. There was no significant difference in expression levels of most chemokine receptors between GO and non-GO cells. Mean (± standard deviation) relative fold changes of three independent experiments for individual subjects are shown (*p < 0.05 vs. non-GO cells). CCL = C-C chemokine ligand; CXCL = C-X-C chemokine ligand; CCR = C-C chemokine receptor; CXCR = C-X-C chemokine receptor.
Chemokines and their receptors are upregulated and then rapidly downregulated during adipogenesis in GO orbital fibroblasts
We induced adipogenesis in confluent orbital fibroblasts from patients with GO (n = 5) for 10 days and evaluated mRNA expression levels of chemokines and their receptors over time. Of the six GO samples, five orbital cell cultures were further analyzed due to contamination of one cell culture. Increased intracytoplasmic lipid droplets were observed over time during adipogenesis. Differentiated cells at day 10 showed a significant level of staining of oil red O in all five GO samples (Supplemental Fig. 1). On day 1, CCL4, CXCL9, CXCL10, CXCL11, and CXCL16 showed greater than two-fold increases in mRNA expression levels compared with levels in postconfluent cells at day 0 (Fig. 2A–2D). However, expression levels started to decrease after day 1, falling below the basal level at the end of adipogenesis (day 10). The expression of CCR1-7 and CXCR1-4 was also high on day 1 but decreased thereafter.
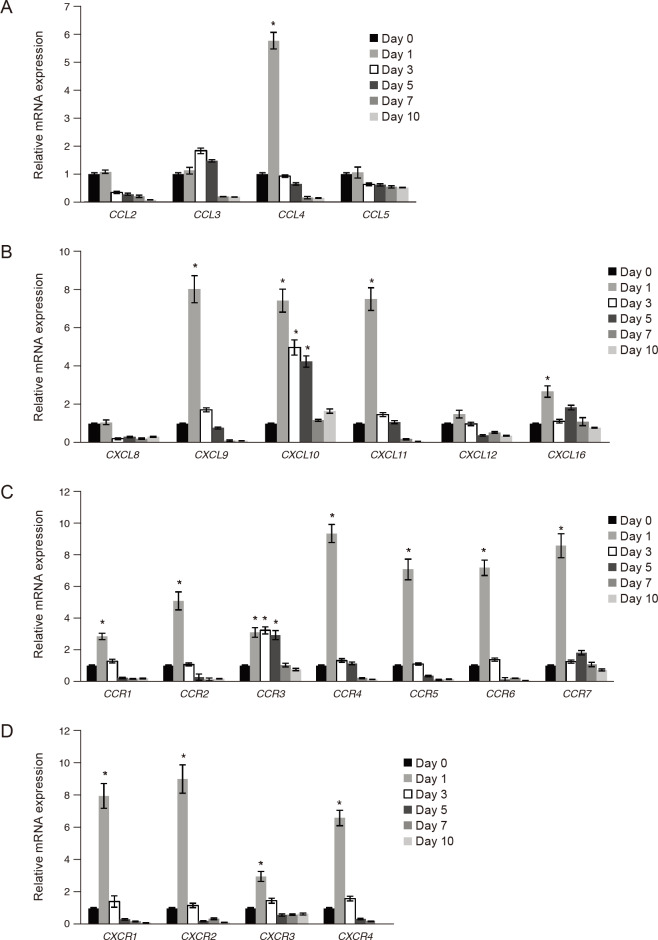
Expression of chemokines and their receptors during adipogenesis of Graves' orbitopathy (GO) orbital fibroblasts. Adipogenesis was induced in GO orbital fibroblasts (n = 5), and messenger RNA (mRNA) expression levels of (A,B) all chemokines and (C,D) chemokine receptors were evaluated at different time points by real-time polymerase chain reaction. Following observation of strong upregulation at an early stage (day 1), the genes were downregulated progressively during adipogenesis. Data are presented as mean (± standard deviation) relative fold changes of three independent experiments for individual subjects (*p < 0.05 vs. day 0 postconfluent cells). CCL = C-C chemokine ligand; CXCL = C-X-C chemokine ligand; CCR = C-C chemokine receptor; CXCR = C-X-C chemokine receptor.
IL-1β and TNF-α stimulate the expression of chemokines and their receptors in GO orbital fibroblasts
We treated primary cultured orbital fibroblasts from patients with GO (n = 5) with the proinflammatory cytokines IL-1β and TNF-α. The mRNA expression levels of CCL2, CCL5, CXCL8, CXCL9, CXCL10, CXCL11, and CXCL12 were significantly increased compared with their levels in each control after stimulation with both IL-1β and TNF-α, while CCL3 and CCL4 were only stimulated by IL-1β (Fig. 3A–3I). The degree of increase in expression differed depending on the specific proinflammatory cytokine involved. For example, CCL5, CXCL9, CXCL10, and CXCL11 showed greater responses to TNF-α than to IL-1β.
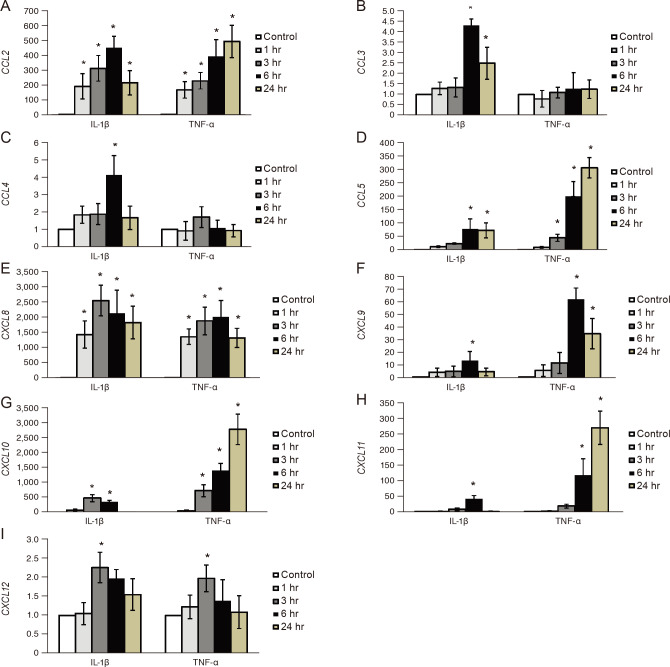
Expression of chemokines after interleukin (IL)-1β and tumor necrosis factor (TNF)-α stimulation. Orbital fibroblasts from patients with GO (n = 5) were treated with IL-1β (10 ng/mL) and TNF-α (10 ng/mL) for 0, 1, 3, 6, and 24 hours. (A–I) The messenger RNA expression levels of chemokines increased, and the magnitude of the response differed between various proinflammatory cytokines. Data are presented as mean (± standard deviation) relative fold changes of messenger RNA of three independent experiments for individual subjects (*p < 0.05 vs. untreated control cells). CCL = C-C chemokine ligand; CXCL = C-X-C chemokine ligand.
Responses of chemokine receptors during inflammatory reactions were similar to those of chemokines. Further, the expression levels of CCR4, CCR5, CXCR2, and CXCR6 were significantly increased compared with their levels in each control after stimulation with both IL-1β and TNF-α, while CCR1, CCR2, CCR3, CCR6, CCR7, CXCR1, CXCR3, CXCR4, and CXCR5 were only stimulated by IL-1β (Fig. 4A–4M).

Expression of chemokine receptors after interleukin (IL)-1β and tumor necrosis factor (TNF)-α stimulation. Orbital fibroblasts from patients with Graves' orbitopathy (n = 5) were treated with IL-1β (10 ng/mL) and TNF-α (10 ng/mL) for 0, 1, 3, 6, and 24 hours. (A–M) The messenger RNA expression levels of chemokine receptors increased, and the magnitude of the response differed between proinflammatory cytokines. Data are presented as mean (± standard deviation) relative fold changes of three independent experiments for individual subjects (*p < 0.05 vs. untreated control cells). CCR = C-C chemokine receptor; CXCR = C-X-C chemokine receptor.
Discussion
The important roles of chemokines in immune and inflammatory reactions via induction of chemotactic migration of leukocytes suggest that they are involved in the pathogenesis of autoimmune diseases [411]. In this study, we investigated nearly all known chemokines including CCL2-5, CXCL9-12, and receptors such as CCR1-7 and CXCR 1-6, which had not been studied in relation to GO.
To our surprise, we found that mRNA levels of chemokines including CCL2, CCL3, CCL4, CCL5, CXCL9, CXCL10, CXCL11, and CXCL12 were all significantly more downregulated in GO tissues than in control tissues. We also evaluated the mRNA expression levels of chemokines and their receptors at different time points during adipogenesis in GO orbital fibroblasts; here, after strong upregulation at an early stage (day 1), expression levels decreased substantially, even to levels below those in cells prior to induction of adipogenesis. Previous studies have indicated that active inflammation occurs in the early stage of GO. T-cell infiltration is remarkably higher in recent-onset active GO specimens compared to in late, inactive GO specimens [12]. Decompression surgery was performed in the inactive late period of GO (2.03 years, on average, and before surgery), as summarized in Table 1. Adipose tissue samples obtained during decompression a re likely composed of proliferated mature adipocytes that have fully recovered from inflammation and differentiation. Low chemokine levels in GO tissue comprised of mature adipocytes correlate well with in vitro data regarding changes in chemokine production during adipogenesis. Considering the short duration of upregulation of chemokines during early adipogenesis in GO orbital fibroblasts, we speculate that anti-inflammatory therapies are ineffective unless used at the active stage. In clinical settings, evaluation of inflammatory activity is crucial for management of GO but is often difficult and imprecise due to a lack of biomarkers available to diagnose the active inflammatory status, other than the clinical activity score. The clinical activity score does not always reflect the inflammatory status, can indicate an incorrect diagnosis of congestion, and can lead to ineffective anti-inflammatory treatment in patients with GO [13]. Our results showed that active chemokine production decreased during adipogenesis compared to before differentiation. T-cells seem to be actively recruited in a very early state of adipogenesis. Anti-inflammatory treatments, including corticosteroids, might have a low therapeutic effect in longstanding fat-predominant proptosis. Although new drugs, such as an insulin-like growth factor-1 receptor monoclonal antibody, anti–cluster of differentiation 20 antibody, and TNF-α blocker, appear effective for GO based on clinical randomized controlled studies, we believe that the timing of treatment is much more important than the use of a certain anti-inflammatory agent [14151617]. Once preadipocytes differentiate into adipocytes, it is necessary to consider treatment options other than systemic anti-inflammation. The window for effective medical treatment may be shorter than previously believed in patients with GO.
Previous studies have reported that, unlike IL-4, IL-5, IL-10, and interferon-γ, the proinflammatory cytokines TNF-α, IL-1β, and IL-6 are mainly detected in early active GO, indicating the predominance of a Th1-like immune response [2181920]. IL-1β increases the production of prostaglandin E2 and hyaluronan in orbital fibroblasts, resulting in orbital tissue expansion [1221]. Our group has also shown that IL-1β exacerbates inflammatory reactions in GO orbital fibroblasts by upregulating sphingosine-1-phosphate receptors, sphingosine kinase, intercellular adhesion molecule-1, cyclooxygenase-2, and IL-6 [22]. Previous studies have found that CCL2, CXCL9, CXCL10, and CXCL11 are upregulated in GO orbital fibroblasts by proinflammatory cytokines [56]. The importance of chemokine–receptor interactions, especially those involving CXCL10, has been confirmed in many autoimmune diseases [11]. Studies of systemic lupus erythematosus have demonstrated a predominant Th1-like immune response and a strong correlation between upregulation of CXCL10 and disease activity [232425]. These results support the contribution of proinflammatory cytokines to the pathogenesis of autoimmune diseases by stimulating CXCL10 secretion, creating an amplification feedback loop, and maintaining autoimmune conditions [11]. We believe this mechanism is also crucial in the pathogenesis of GO. Additional in-depth studies are needed to evaluate other chemokines. Moreover, our results suggest that chemokines are candidate markers of GO activity.
However, there is a limitation because this study was performed only with fibroblasts and did not include lymphocytes attracted by chemokines. Also, the adipogenesis condition in vitro could be quite different from that in vivo; therefore, it remains difficult to determine the exact point of chemokine upregulation during adipogenesis in a clinical environment. The use of orbital tissues harvested during orbital fracture repair or evisceration might not be a perfect control to use in comparison with GO tissues. In vivo animal studies might be required to investigate a causal relationship between adipogenesis and chemokines and to support the development of a new therapeutic drug targeting chemokines.
In conclusion, we investigated the strong upregulation of chemokines at the initial phase of adipogenesis and subsequent downregulation until the end of differentiation. Although the in vitro pathophysiology of adipogenesis cannot reflect precise orbital fat volume increase in GO patients, we carefully speculate that anti-inflammatory therapy is expected to be more effective in the early active stage of GO, when chemokines are upregulated. We also demonstrated that chemokines and their receptors are upregulated after stimulation by IL-1β and TNF–α, suggesting a crucial role of proinflammatory cytokines in the pathogenesis of GO and further indicating that chemokines could be used as biomarkers of GO activity.
Acknowledgements
This research was supported by the Basic Science Research Program through the National Research Foundation of Korea (NRF) funded by the Ministry of Science and ICT (2017R1A2B4009565).
Notes
Conflict of Interest: No potential conflict of interest relevant to this article was reported.
References
Supplemental Material
Supplemental Fig. 1. is available from: https://doi.org/10.3341/kjo.2020.0002.
Supplemental Fig. 1
Oil red O staining in cells with adipogenesis. Adipogenesis was induced in Graves' orbitopathy (GO) orbital fibroblasts (n = 5) for 10 days. At days 0 and 10 of differentiation, cells were stained with oil red O solution mixture and photographed using a light microscope (Axiovert; Carl Zeiss AG, Oberkochen, Germany) (×40).