Influence of Epiretinal Membranes on the Retinal Nerve Fiber Layer Thickness Measured by Spectral Domain Optical Coherence Tomography in Glaucoma
Article information
Abstract
Purpose
We investigated changes in the thickness of the peripapillary retinal nerve fiber layer (RNFL) following the onset of an epiretinal membrane (ERM) in glaucoma patients.
Methods
Among regularly monitored glaucoma patients, patients with a newly diagnosed ERM were consecutively enrolled. Before and after the onset of ERM, the RNFL thickness was measured using spectral domain optical coherence tomography, and a visual field examination was performed using a Humphrey field analyzer. Changes in RNFL thickness parameters and global indices of the visual field analyzer were assessed.
Results
In a total of 28 eyes from 28 patients, the average RNFL thickness increased by a mean of 4.0 ± 7.4 µm (p = 0.009) after ERM onset. There was an increase in the superior, nasal, and temporal quadrant RNFL thicknesses, and the change in the temporal RNFL thickness was significant (14.4 ± 21.2 µm, p < 0.001). However, the inferior RNFL thickness decreased by −0.6 ± 7.5 µm (p = 0.116). In the visual field examination, the mean deviation decreased significantly by −0.8 ± 1.7 dB (p = 0.038), from −14.6 to −15.4 dB.
Conclusions
A significant increase in average RNFL thickness was detected following ERM onset in glaucoma patients, although there was deterioration of the mean deviation in the visual field. When ERM occurs in glaucoma patients, clinicians should be aware that RNFL thickness measurements obtained with a spectral domain optical coherence tomography may underestimate the status of glaucomatous optic neuropathy.
Optical coherence tomography (OCT) imaging has evolved drastically over the last decade [1]. Spectral domain OCT (SD-OCT) has become an important and useful tool for quantitatively evaluating the optic disc and peripapillary retinal nerve fiber layer (RNFL), and is therefore widely used to diagnose glaucoma [2345]. Additionally, because RNFL thickness measurements that are made using SD-OCT are highly reliable and reproducible [67], regular SD-OCT in glaucoma patients is helpful for detecting glaucomatous progression [345].
Although SD-OCT results in accurate and reproducible measurements, artifacts can occur that interfere with interpretability. Giani et al. [8] and Sull et al. [9] reported that artifacts were common in disease states such as uveitis, an epiretinal membrane (ERM), diabetic retinopathy, and macular degeneration (8% to 90% of all scans). Asrani et al. [10] reported that ocular diseases such as vitreomacular traction, age-related macular degeneration, high myopia, and ERMs commonly show artifacts on SD-OCT, and the most frequent artifacts occurred in patients with ERM.
Several studies have recently examined the effects of ERMs on RNFL thickness measurements using SD-OCT. The RNFL is significantly thicker in eyes with ERM compared to eyes without ERM [111213]. Some studies have reported a significant decrease in RNFL thickness after surgical removal of ERM [14151617]. ERMs usually arise from the macula and extend to the optic disc; thus, they can affect peripapillary RNFL thickness measurements [11]. The prevalence of ERM increases with age, and similar to glaucoma [18], the prevalence of ERM is 5.3% to 18.5% in the general population [1920212223] and 35% in patients 70 to 75 years of age [242526]. Comorbidities of ERM and glaucoma are expected to be common [10].
To date, a longitudinal study that characterizes the influence of ERM onset on the RNFL thickness in glaucoma patients has not yet been reported. The primary purpose of this study was to determine whether there was a significant effect of ERM onset on the measurement of RNFL thickness using SD-OCT in glaucoma patients. A secondary purpose was to determine the possible relationships between changes in RNFL thickness and/or central macular thickness and changes in the results of Humphrey field analyzer measurements following the onset of ERM.
Materials and Methods
This retrospective study was approved by the institutional review board of the Chungnam National University Hospital (2018-01-032-001), and adhered to the tenets of the Declaration of Helsinki. Informed consent was waived due to the retrospective nature of the study. Patients diagnosed with glaucoma and an accompanying ERM were recruited after a review of the electronic medical records of glaucoma patients who visited the outpatient department of Chungnam National University Hospital between January 2016 and December 2017. The patient's previous medical records, fundus photographs, and macular scans that were obtained by SD-OCT were reviewed. Only patients whose ERM was newly diagnosed were consecutively enrolled. Patients with optic neuropathy other than glaucoma, or retinal diseases other than ERM, were excluded. Other exclusion criteria were best-corrected visual acuity (BCVA) <0.5 and high myopia with a spherical equivalent <−8 diopters, or an axial length >26.0 mm. Patients who underwent intraocular surgery, excluding cataract surgery that was performed more than 6 months prior to data acquisition, were also excluded.
Glaucoma was diagnosed based on glaucomatous optic neuropathy and corresponding visual field defects. Glaucomatous optic neuropathy was defined as a vertical cup-to-disc ratio >0.6, a difference in the vertical cup-to-disc ratio between both eyes >0.2, diffuse or focal thinning of the neuroretinal rim, or an RNFL defect. A glaucomatous visual field defect was defined as follows: 1) a cluster of three points with a probability <5% on a pattern deviation map in at least one hemifield and including at least one point with a probability <1%, or a cluster of two points with a probability <1%; 2) glaucoma hemifield test results outside normal limits; or 3) a pattern standard deviation <5% on at least two consecutive baseline visual field tests. The patients used intraocular pressure (IOP)-lowering medications based on the guidance of a glaucoma specialist.
The enrolled patients were regularly checked for BCVA and subjected to auto-refractometry, slit-lamp biomicroscopy, Goldmann applanation tonometry, and a dilated fundus examination. Dilated fundus photography, SD-OCT (Cirrus HD OCT; Carl Zeiss Meditec, Dublin, CA, USA), and 24-2 Swedish interactive threshold algorithm standard perimetry (Humphrey Field Analyzer II; Carl Zeiss Meditec) were also performed regularly.
Data selection before and after ERM onset
Optic disc scans using the 200 × 200 optic disc cube protocol for peripapillary RNFL thickness measurements were performed using a Cirrus HD OCT instrument. Images that had a signal strength ≥6, and the absence of any artifacts caused by eye motion, blinking, poor centration, or segmentation error, were included in the statistical analysis. RNFL thickness evaluation parameters included average thickness (360° measurement) and the thickness of four quadrants (temporal, superior, nasal, and inferior). Pre-ERM RNFL thickness data were obtained from optic disc scans that were performed when the patient previously experienced standard perimetry at least three times, and when the patient did not have ERM based on dilated fundus photography and on macular scans, including a 512 × 128 macular cube scan and high definition line raster scan that used Cirrus HD OCT. Post-ERM RNFL thickness data were obtained when ERM was newly diagnosed, based on dilated fundus photography and the Cirrus HD OCT macular scans.
Peripapillary involvement of ERM was also investigated. Peripapillary involvement was defined as one or more scanned images of the high-definition line raster scan that showed an ERM that extended over the scan circle of the peripapillary RNFL thickness measurement (Fig. 1A–1C).
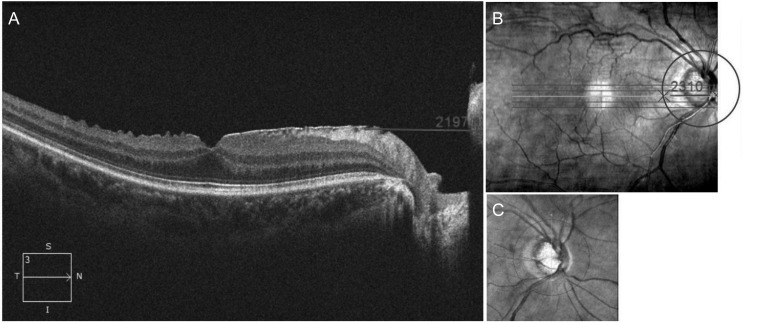
Peripapillary involvement of the epiretinal membrane (ERM) was confirmed using (A) an axial view and (B) en face view of the high-definition line raster scan including the macular and optic disc. (A) The distance from the nasal boundary of the ERM to the nasal end of the scanned image was measured using a scale embedded in Cirrus HD optical coherence tomography. (C) After the scan circle of the peripapillary retinal nerve fiber layer overlapped on an en face view of the macular scan, (B) the distance from the crossing point of the scan circle of the peripapillary retinal nerve fiber layer and raster scan line to the nasal end of the raster scan line was measured using the same embedded scale. ERM with peripapillary involvement was defined as a case with a longer distance measured in (B) than in (A).
Pre-ERM Humphrey visual field (HVF) data were defined as those measured within 6 months prior to acquisition of the pre-ERM RNFL thickness data. Post-ERM HVF data were defined as those conducted within 6 months after the acquisition of the post-ERM RNFL thickness data. Unreliable results from HVF examinations (fixation loss >20% or a false-positive rate >15%) were excluded from the statistical analysis.
All statistical analyses were performed using PASW Statistics ver. 18.0 (SPSS Inc., Chicago, IL, USA). The Wilcoxon signed-rank test was conducted to examine differences between pre-ERM and post-ERM data. The relationship between changes in average RNFL thickness and changes in the mean deviation from HVF were analyzed using the Spearman's correlation coefficient. A value of p < 0.05 was considered statistically significant.
Results
The study included 28 eyes from 28 patients (16 males and 12 females). The mean patient age was 61.4 ± 8.1 years (range, 44 to 73 years). Twenty-two eyes had primary open-angle glaucoma, and six patients had pseudoexfoliative glaucoma, uveitic glaucoma, or chronic angle-closure glaucoma (Table 1).

Patient demographics (n = 28)
All of the enrolled patients had ERM with peripapillary involvement. Table 2 shows the changes in RNFL thickness and central macular thickness following the onset of ERM. The average RNFL thickness increased significantly by 4.0 ± 7.4 µm (from 69.5 ± 16 to 73.5 ± 19.3 µm, p = 0.009). A significant change was observed in the temporal quadrant (from 60.3 ± 16.8 to 74.8 ± 31.0 µm, p < 0.001), but not in the superior, nasal, or inferior quadrant. The central macular thickness increased by 33.4 ± 21.7 µm (p < 0.001). The mean time interval for SD-OCT examinations between pre-ERM and post-ERM was 28.1 ± 12.8 months. The mean IOP during t his period was 17.6 ± 3.1 m mHg, which was calculated as the sum of all IOP values recorded during this period divided by the total number of IOP examinations.

Retinal nerve fiber layer thickness and central macular thickness changes following ERM onset
Table 3 shows changes in the BCVA and the results of the HVF examination following ERM onset. The BCVA was converted to the logarithm of the minimum angle of resolution units for statistical analysis, and then converted back into decimals. There was no significant change in the BCVA (0.7 ± 0.2 to 0.7 ± 0.2, p = 0.864). The mean deviation (MD) decreased significantly by −0.8 ± 1.7 dB (−14.6 ± 9.2 to −15.4 ± 8.6 dB, p = 0.038). The pattern standard deviation and the visual field index did not show significant changes (p = 0.533 and 0.468, respectively). The mean interval between the pre-ERM HVF examinations and post-ERM HVF examinations was 35.0 ± 13.2 months. The mean IOP during this period was 17.1 ± 3.4 mmHg, which was not significantly different from the mean IOP calculated during the pre-ERM and post-ERM OCT examinations.
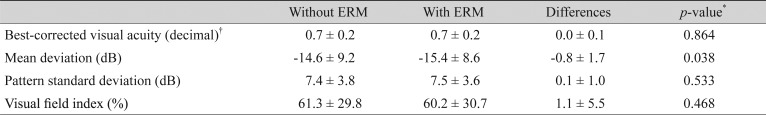
Changes in visual acuity and global index of the Humphrey visual field test following ERM onset
There was no significant correlation between the change in the average RNFL thickness and change in the MD (r = 0.010, p = 0.961) or between the change in the central macular thickness and change in the MD (r = 0.216, p = 0.674). The change in central macular thickness was not correlated with the average RNFL thickness or superior, inferior, or nasal RNFL thickness, but was correlated with the temporal RNFL thickness (r = 0.418, p = 0.022).
Fig. 2 shows the right eye of a representative patient. The interval of the fundus photographs and Cirrus HD OCT scans between pre-ERM (Fig. 2A) and post-ERM (Fig. 2B) was 18 months, and the interval of the HVF examination between pre-ERM and post-ERM was 22 months. The average RNFL thickness increased from 70 to 79 µm following ERM onset. The RNFL thicknesses in all quadrants increased; however, the MD decreased from −12.41 to −13.18 dB on HVF examinations.

Representative case of the right eye of a 54-year-old female patient with bilateral primary open-angle glaucoma. Fundus photography, spectral domain-optical coherence tomography, and Humphrey visual field (HVF) results performed before the onset of an epiretinal membrane (ERM) (A), and after ERM onset (B). The interval of the fundus photograph and spectral domain-optical coherence tomography between (A) and (B) was 18 months; the interval of the HVF examinations between (A) and (B) was 22 months. The average retinal nerve fiber layer thickness increased from 70 to 79 µm after ERM development. The retinal nerve fiber layer thicknesses in all quadrants increased; however, the mean deviation decreased from −12.41 to −13.18 dB on HVF examinations. T = temporal; S = superior; N = nasal; I = inferior.
Discussion
This is the first study to investigate the inf luence of ERM development on RNFL thickness measured by SD-OCT in glaucoma patients. Our results show that in glaucoma patients, the average RNFL thickness increased significantly after ERM development. Analyses of quadrant RNFL thicknesses indicated that the temporal RNFL thickness significantly increased. This is consistent with previous studies in patients without glaucoma [11121427].
Evaluation of RNFL thicknesses by SD-OCT, as well as optic disc examinations and visual field tests, are currently indispensable for the diagnosis and follow-up for patients with glaucoma. Because RNFL damage is often preceded by visual field damage, SD-OCT is particularly helpful in diagnosing early glaucoma, and it can monitor the progression of glaucoma more objectively because the test-retest variability is lower than that for the visual field test [2345]. However, various artifacts have been reported to interfere with the interpretation of the SD-OCT results. Among them, ERM is one of the major causes of artifacts, including segmentation errors, so that the measured RNFL thickness often exceeds the actual thickness [10]. Segmentation error occurs when SD-OCT mistakes the high reflectivity of ERM as the upper boundary of the RNFL or the internal limiting membrane of the retina, resulting in an exaggerated thickness measurement. Histopathologically, ERM is caused by fibrocellular proliferation on the internal limiting membrane [24], which gradually contracts, causing retinal tangential traction that can lead to various changes in retinal structure [141516]. Oh et al. [14] suggested that ERM can induce movement of the superior RNFL hump toward the fovea on the temporal side. As a result, the temporal RNFL becomes thicker compared to that in the contralateral eye without ERM. In addition, the contractile force of ERM can cause retinal vascular deformation, leading to edema of the RNFL; in turn, this can increase the RNFL thickness [1728]. Lee et al. [11] reported that the average RNFL thickness and temporal quadrant RNFL thicknesses measured by SD-OCT in patients with ERM were thicker than those in patients without ERM. Additionally, they divided patients with ERM into two groups, based on whether ERM involved the peripapillary area, and the RNFL thickness was greater in the group with peripapillary involvement. In our study, all of the patients had ERM with peripapillary involvement.
The relationship between ERM and glaucoma should be considered in terms of three aspects. First, diagnosing glaucoma in patients with ERM, in which the boundary of the RNFL defect is not clearly demarcated and the glaucomatous visual field defect is not apparent, can be delayed because of peripapillary RNFL thickening caused by ERM, which can obscure diffuse or localized thinning of the RNFL. Second, detection of the glaucomatous progression can be delayed if ERM newly occurs in patients with glaucoma, in which visual field progression is not considerable. In glaucoma, deterioration of the visual field is accompanied by a corresponding thinning of the RNFL over time. However, in the present study, despite worsening of the MD by −0.8 dB (p = 0.038) between the pre-ERM and post-ERM HVF tests, the average RNFL thickness showed an increase of 4.0 µm (p = 0.009) at pre-ERM compared with post-ERM OCT, indicating that the RNFL thickness measured by SD-OCT did not reflect the glaucoma status. Previous studies have shown that ERM can affect not only visual acuity but also the peripheral visual field [121329]. Therefore, it can be difficult to determine whether worsening of the MD is caused by glaucoma progression or ERM. Our patients were expected to have early-stage ERM, because we collected the SD-OCT and HVF data immediately after discovering ERM. The analysis indicated that there was no significant change in visual acuity from before to after ERM onset (p = 0.864), and none of the patients complained of metamorphopsia. In addition, the changes in the RNFL and central macular thicknesses were not associated with a change in the MD (p = 0.961 and p = 0.674, respectively). Third, patients who undergo vitrectomy and removal of ERM may be misdiagnosed with glaucoma if RNFL thinning is detected [1430]. Previous studies that investigated changes in RNFL thickness following ERM removal showed that the RNFL thickness decreased after surgery. Oh et al. [14] and Lee et al. [28] suggested that the RNFL could be damaged during surgery because not only was the layer thinner than before surgery, but it was also thinner when compared to the contralateral eye without ERM. Gass et al. [31] suggested some possible causes of RNFL thinning following ERM surgery, including an increased IOP during surgery, phototoxicity caused by an illuminator, mechanical damage caused by removal of the internal limiting membrane, cytotoxicity arising from indocyanine green dye use, and stimulation of the optic nerve head during the induction of posterior vitreous detachment. Lalezary et al. [32] reported that the inferior quadrant RNFL was thinned in eyes that underwent ERM removal; therefore, this should be monitored for differential diagnosis of early glaucomatous changes.
There were some limitations to this study. First, because of the retrospective nature, the pre-ERM and post-ERM SD-OCT and HVF data were not collected at the same time points. However, to minimize the time difference between examinations, the maximum interval between SD-OCT and the HVF test was limited to 6 months. Second, because the number of enrolled patients was small, we could not analyze differences according to the type and severity of glaucoma. Of note, it was difficult to recruit patients with glaucoma and that involved follow-up monitoring during the time points from before ERM until after ERM had occurred. Finally, further progression of ERM can be expected to increase the risk of affecting the MD. Therefore, we tried to eliminate the effects of ERM on the MD by collecting post-ERM data as early as possible, but there was still a possibility that ERM affected the MD.
In conclusion, this study shows a significant increase in RNFL thickness following the onset of ERM in patients with glaucoma. The average RNFL thickness and temporal quadrant RNFL thickness increased, even though significant progression in the visual field defect was noted during the study period. Therefore, it is possible that RNFL thickness measurements by SD-OCT may underestimate the progression of glaucoma when ERM occurs during the follow-up for glaucoma patients.
Notes
Conflict of Interest: No potential conflict of interest relevant to this article was reported.