Effects of Choroidal Thickness on Refractive Outcome Following Cataract Surgery in Primary Angle Closure
Article information
Abstract
Purpose
To identify the preoperative biometric factors, including subfoveal choroidal thickness (CT), associated with refractive outcome after cataract surgery in eyes with primary angle closure (PAC).
Methods
This study included 50 eyes of 50 PAC patients who underwent uneventful cataract surgery. Preoperatively, anterior segment parameters including anterior chamber depth (ACD) and lens vault were determined by anterior segment optical coherence tomography. Subfoveal CT was measured by spectral domain optical coherence tomography enhanced depth imaging before and at one month after surgery. Mean refractive error (MRE) was calculated as the difference in spherical equivalent between actual postoperative refraction determined one month postoperatively and that predicted using each of three IOL calculation formulas (SRK/II, SRK/T, and Haigis). Regression analyses were performed to investigate potential associations between MRE and putative factors.
Results
Mean ACD was 1.9 ± 0.4 mm, and preoperative subfoveal CT was 250.8 ± 56.9 µm. The SRK/T (MRE, 0.199 ± 0.567 diopters [D]) and Haigis (MRE, 0.190 ± 0.727 D) formulas showed slight hyperopic shift, while the SRK/II formula demonstrated a myopic shift (MRE, −0.077 ± 0.623 D) compared with that expected after cataract surgery. Mean absolute refractive error was not significantly different between formulas. Higher preoperative lens vault and shallower ACD were associated with a hyperopic shift in all formulas, but not in a statistically significant manner. Thicker preoperative subfoveal choroid was associated with a myopic shift after cataract surgery in all formulas (SRK/II: β = −0.511, p < 0.001; SRK/T: β = −0.652, p < 0.001; Haigis: β = −0.671, p < 0.001). Greater postoperative reduction of subfoveal CT was associated with a myopic shift after cataract surgery in all formulas (SRK/II: β = −0.511, p < 0.001; SRK/T: β = −0.652, p < 0.001; Haigis: β = −0.671, p < 0.001).
Conclusions
Our results indicate that preoperative subfoveal CT and the difference between pre- and postoperative subfoveal CT are significant factors for predicting refractive error after cataract surgery in PAC patients. These findings should be considered when performing cataract surgery to optimize visual outcomes.
Primary angle-closure glaucoma (PACG) is a leading cause of blindness worldwide, especially in Asia [1]. Since pupillary block (PB) is the main mechanism of primary angle closure (PAC), laser peripheral iridotomy (LPI), which aims for resolution of PB, is considered the initial treatment modality [23]. However, as a substantial proportion of PAC eyes show persistent narrow-angle or progressive worsening of peripheral anterior synechiae after successful LPI, these eyes often need further treatment [3]. Lens extraction is commonly performed to treat angle closure, especially when the lens appears to be the principal cause of PAC [45]. Recently, data from a randomized clinical trial showed favorable outcomes with clear lens extraction in the treatment of PAC [6]. An important concern, however, in performing lens extraction for PAC is the possibility of inaccurate refractive outcome [78]. Several studies have reported on the inaccuracy of refractive outcome in cataract extraction in PAC eyes, with preoperative factors such as the degree of lens vault (LV) suggested to be related to the poor results [910].
There is evidence from recent publications that choroidal thickness (CT) is increased in PAC eyes, emphasizing the role of the choroid in the development of PAC [1112]. Although this issue remains under debate [131415], there seemed to be some subgroup of PAC patients who had increased CT. If the CT was increased at some period in PAC eyes due to swelling of the choroid and then subsequently resolved afterward, that would change the refractive status.
Hence, we hypothesized that increased CT may affect the refractive outcome of cataract surgery in eyes with PAC. To test our hypothesis, we estimated preoperative subfoveal CT and evaluated the effects of subfoveal CT on refractive outcome after cataract extraction, along with other parameters.
Materials and Methods
Subjects
Reviewed in this study were 50 PAC eyes of 50 patients who had undergone uneventful cataract surgery. The medical records of all subjects evaluated by one glaucoma specialist (KRS) from January 2011 to April 2017 in the glaucoma clinic of the Asan Medical Center in Seoul, Korea, were retrospectively examined. Previously, we reported that PAC and PACG do not differ in terms of anterior segment parameters [16]. Therefore, eyes with PAC or PACG were pooled, and both were included in the current analysis. The presence of PAC or PACG was determined on the basis of gonioscopic examination. Specifically, PAC was diagnosed when an eye had an occludable angle and exhibited features indicative of trabecular obstruction by the peripheral iris (elevated intraocular pressure [IOP], peripheral anterior synechiae, iris whorling [distortion of the radially orientated iris fibers], “glaukomflecken” lens opacity, or excessive pigment deposition on the trabecular surface) without a glaucomatous optic disc or any visual field change [17]. PAC eyes showing glaucomatous optic disc changes (e.g., neuroretinal rim thinning, disc excavation, and/or optic disc hemorrhage due to glaucoma) or a glaucomatous visual field change (pattern standard deviation <5% and values outside normal limits in the glaucoma hemifield test) were considered to have PACG [17]. Only reliable visual field test results (false-positives <15%, false-negatives <15%, and fixation loss <20%) were included in the analysis. Subjects with secondary angle closure due to an intumescent lens, uveitis, ocular trauma, choroidal effusion, suprachoroidal hemorrhage, medication (e.g., topiramate use), or previous intraocular surgical procedure were excluded from this study. In addition, individuals with past or present ocular disease other than PAC or mild cataract were excluded.
The study protocol was approved by the institutional review board of the Asan Medical Center (2017-0424), and the study design followed the principles of the Declaration of Helsinki. Informed consent was waived due to the retrospective nature of the study.
Preoperative and postoperative ophthalmologic examinations
Initial testing comprised a comprehensive ophthalmologic examination, including a review of the medical history, measurement of best-corrected visual acuity, performance of slit-lamp biomicroscopy, and repeated IOP measurement by Goldmann applanation tonometry (Haag-Streit AG, Koeniz, Switzerland). Preoperative and postoperative refractive errors were measured with manifest refraction. Anterior segment optical coherence tomography (AS-OCT) imaging (Visante ver. 2.0; Carl Zeiss Meditec, Jena, Germany) was performed to measure anterior chamber depth (ACD), LV, central corneal thickness, and angle-opening distance at 500 µm (AOD 500).
Preoperative IOL power calculations were performed with the IOLMaster Optical Biometer (Carl Zeiss Meditec). Predicted refractive outcomes were calculated using the Haigis, SRK/II, and SRK/T formulas [18]. The postoperative refractive errors measured at one month after surgery were analyzed. Mean refractive error (MRE) was calculated as the difference of spherical equivalent between predicted and actual postoperative refraction values assessed at 1-month post-surgery for each of the three IOL calculation formulas. Mean absolute error (MAE) indicated the absolute number of calculated MRE values.
The affected eyes of all participants were imaged at the nasal and temporal angles using AS-OCT (Visante ver. 2.0) operating in the enhanced anterior segment single mode (scan length 16 mm, 256 A-scans). The anterior segment parameters in each image were evaluated by an independent examiner (WKS), who was blinded to all other test results and the clinical information of the participants. All AS-OCT parameters were determined using the Image J software ver. 1.46 (National Institutes of Health, Bethesda, MD, USA). ACD was defined as the maximum distance, measured perpendicularly to the horizontal line connecting the two scleral spurs, between the posterior corneal surface and the anterior lens surface. LV was defined as the perpendicular distance between the anterior pole of the crystalline lens and the horizontal line joining the two scleral spurs. AOD 500 was defined as the linear distance between the point of the inner corneoscleral wall (500 µm anterior to the scleral spur) and the iris [1920].
Analysis of subfoveal CT using spectral-domain optical coherence tomography
All patients underwent spectral-domain optical coherence tomography (SD-OCT; Spectralis, Heidelberg Engineering, Heidelberg, Germany) imaging following pupil dilatation. Choroid imaging was obtained with enhanced depth imaging technique. A single independent ophthalmologist (JWS), blinded to the clinical diagnosis, performed measurements of the macular regional CT, whereby horizontal and vertical scans passing directly through the center of the fovea were selected. The resulting images were viewed and measured with the Heidelberg Eye Explorer ver. 1.5.12.0 (Heidelberg Engineering). The subfoveal CT was defined as the distance from the outer portion of the hyperreflective line corresponding to the RPE to the inner surface of the sclera. Measurements were performed at the subfovea and at 1 and 3 mm from the fovea superiorly, inferiorly, temporally, and nasally (Fig. 1A, 1B) [212223]. Postoperative subfoveal CT was acquired at one month postoperatively using the same method.
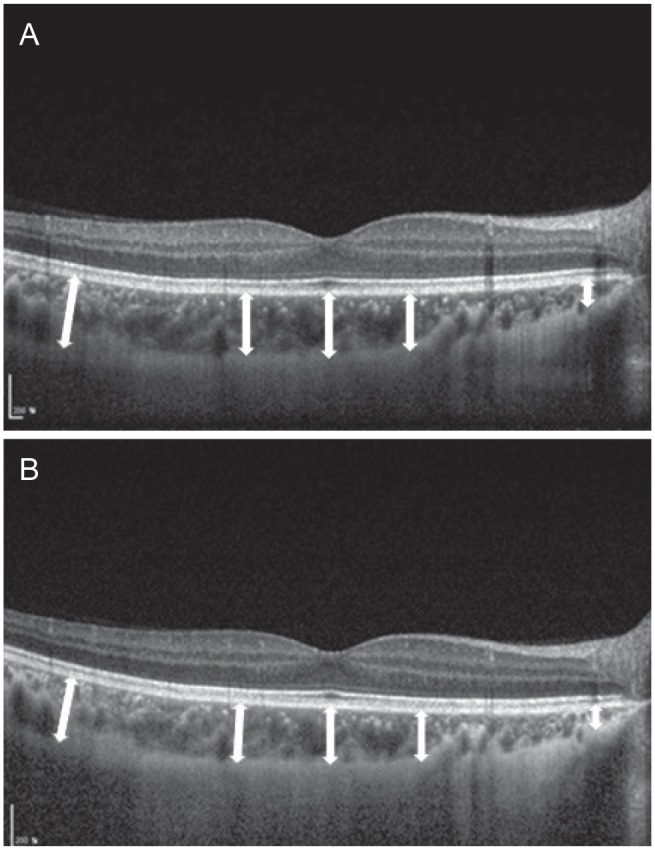
Choroidal thickness was measured at the subfovea and at 1 and 3 mm from the fovea superiorly, inferiorly, temporally, nasally by spectral-domain optical coherence tomography scan image. Mean choroidal thickness was (A) 243.4 µm before surgery and (B) 231.6 µm at one month after surgery. This eye showed a −0.75 diopters myopic shift compared with the expected refraction after cataract surgery.
Surgical procedures
All of the procedures were performed by one surgeon (KRS). A temporal corneal incision, continuous curvilinear capsulorrhexis, hydrodissection, and phacoemulsification with the OZil torsional system (Infiniti; Alcon, Fort Worth, TX, USA) were performed. A foldable posterior chamber IOL was implanted in the capsular bag. The IOLs used in the study were one-piece acrylic versions (Hoya iSert 250; Hoya Surgical Optics, Tokyo, Japan). No intraoperative complications occurred. The power of the implanted IOL was calculated with the preoperative biometric data and the IOL power formula for each patient. The predicted refraction values were estimated using the calculated power of the implanted IOL.
Analysis
All statistical analyses were performed using commercial software (IBM SPSS Statistics ver. 21.0; IBM Corp., Armonk, NY, USA). The one-way analysis of variance and Bonferroni post-hoc tests were used to compare the predictive accuracy of the three IOL calculation formulas. Univariate and multivariate regression analyses were performed to evaluate the influence of preoperative biometric factors on refractive outcome and correlation between preoperative and postoperative subfoveal CT values and refractive outcome. In the multivariate analysis, variables that retained significance at p < 0.1 in the univariate analysis were included. Probability values with p < 0.05 were considered to be statistically significant.
Results
Baseline characteristics
Fifty eyes of 50 angle closure patients who had undergone uneventful cataract surgery were included in this study. The preoperative and postoperative clinical data are summarized in Table 1. The mean age was 69.4 ± 8.3 years, and 42 of the 50 subjects were female. Of the 50 subjects, 17 (34.0%) had undergone LPI before cataract surgery.
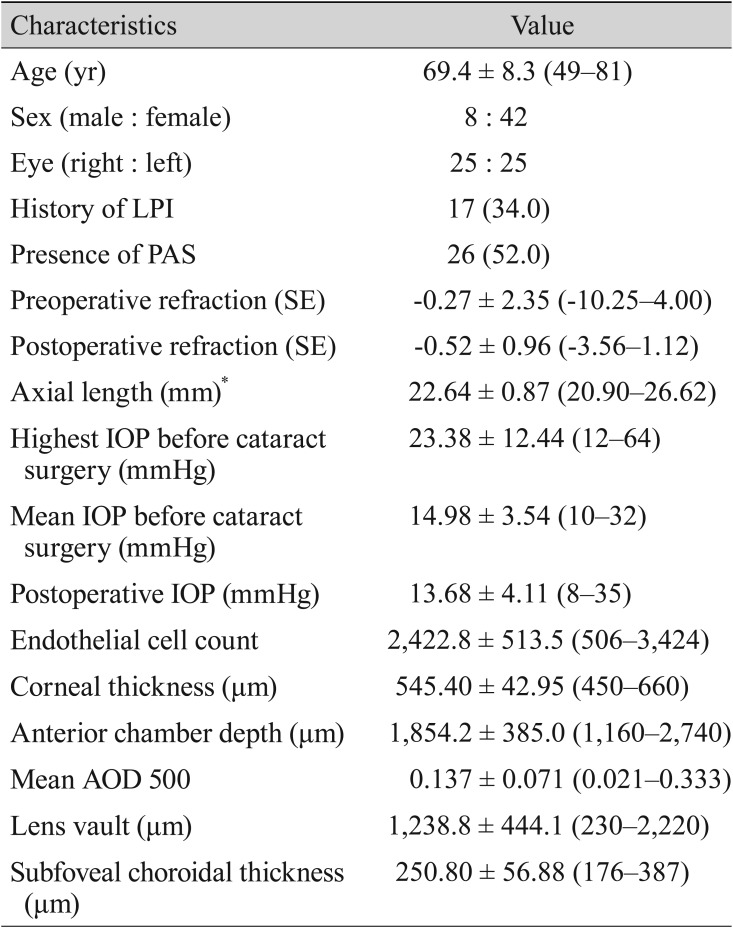
Demographic and clinical characteristics of the participants (n = 50)
Refractive errors of various intraocular calculation formulas
The comparison of predicted and actual postoperative 1-month refractive errors showed a hyperopic shift for the SRK/T (MRE, 0.199 ± 0.567 diopters [D]) and Haigis (MRE, 0.190 ± 0.727 D) formulas and a myopic shift for the SRK/II formula (MRE, −0.077 ± 0.623 D) (Table 2). The MREs of the SRK/II formula from the IOLMaster Optical Biometer (Carl Zeiss Meditec) were significantly lower than those of the other two formulas, indicating more myopic prediction with this formula (p < 0.001). The MREs of the SRK/T and Haigis formulas were not statistically different from each other (p = 1.00).
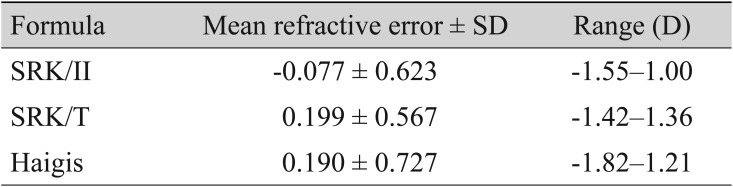
Mean refractive error (range) with various intraocular lens calculation formulas of the IOLMaster
In contrast with the MRE results, the MAE results indicated that there were no significant differences among all three formulas (MAE, 0.512 ± 0.364 D for SRK/II; MAE, 0.512 ± 0.328 D for SRK/T; MAE, 0.593 ± 0.461 D for Haigis) (Table 3). The MAEs of the SRK/T formula from the IOLMaster Optical Biometer tended to be higher than those of the Haigis formula, but not in significantly significant manner (p = 0.083).
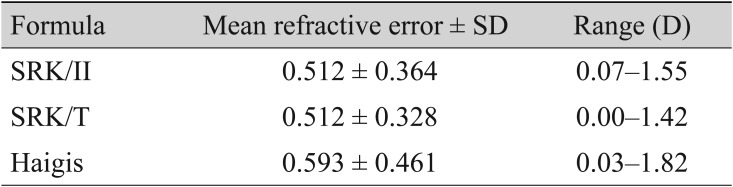
Mean absolute error (range) with various intraocular lens calculation formulas of the IOLMaster
Factors associated with postoperative refractive error
The associations between the considered preoperative biometric factors and MRE values were investigated using univariate and multivariate regression analysis. The univariate and multivariate analysis results according to the different IOL calculation formulas (SRK/II, SRK/T, and Haigis) are provided in Tables 4, 5, and 6.
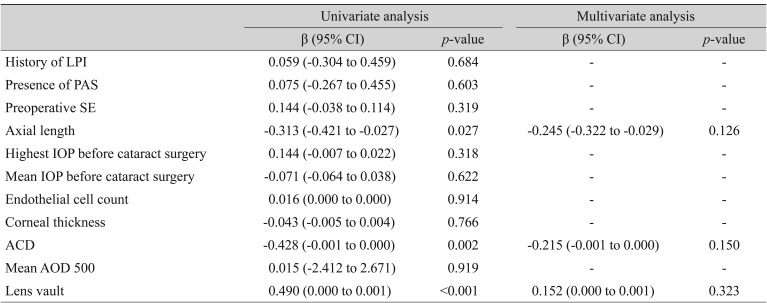
Univariate and multivariate analyses of associations between preoperative risk factors and postoperative mean refractive error (SRK/II of IOLMaster)
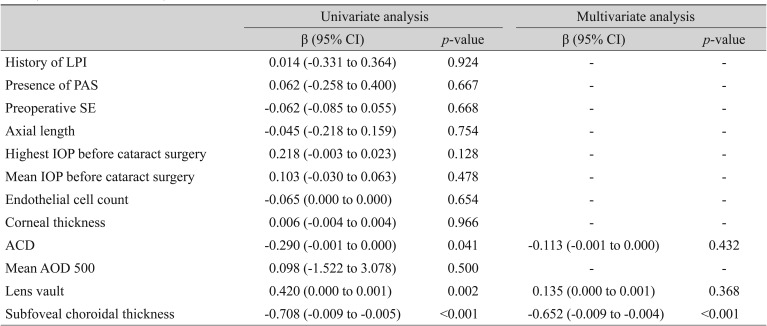
Univariate and multivariate analyses of associations between preoperative risk factors and postoperative mean refractive error (SRK/T of IOLMaster)
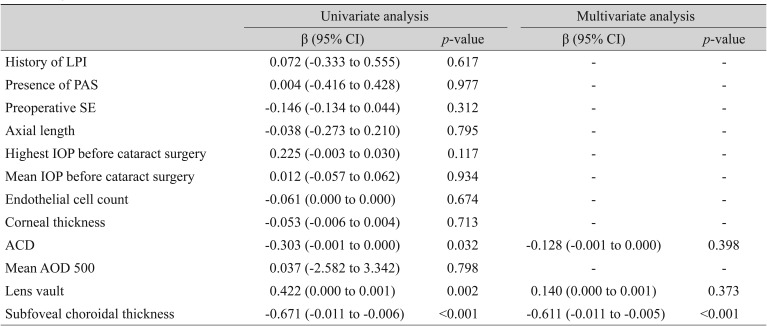
Univariate and multivariate analyses of associations between preoperative risk factors and postoperative mean refractive error (Haigis of IOLMaster)
Using the MREs calculated by the three formulas, univariate regression analysis showed that higher LV and shallower ACD were associated with a more significant hyperopic shift of the refractive outcome, but this association was not observed in multivariate regression analysis (backward variable elimination) (LV SRK/II: β = −0.152, p = 0.323; SRK/T: β = −0.135, p = 0.368; Haigis: β = −0.140, p = 0.373 and ACD SRK/II: β = −0.215, p = 0.150; SRK/T: β = −0.113, p = 0.432; Haigis: β = −0.128, p = 0.398) (Table 3, 4, 5). In addition, a thicker preoperative subfoveal choroid was associated with a more significant myopic refractive shift after cataract surgery. When MREs calculated by the three IOL calculation formulas (SRK/II, SRK/T, and Haigis) were incorporated into univariate and multivariate analyses in the same manner, thicker preoperative CT showed strong negative correlation with MRE (SRK/II: β = −0.511, p < 0.001; SRK/T: β = −0.652, p < 0.001; Haigis: β = −0.671, p < 0.001) (Table 3, 4, 5).
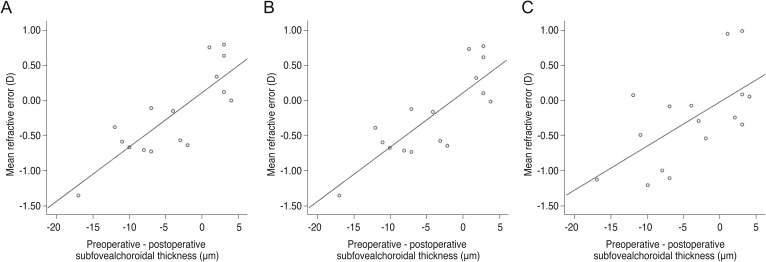
We observed significant linear correlations between MRE and subfoveal CT with the SRK/II, SRK/T, and Haigis IOL calculation formulas. Using linear regression analysis, the association between subfoveal CT and postoperative MRE showed a more myopic refractive shift after cataract surgery (SRK/II: r2 = 0.350, p < 0.001; SRK/T: r2 = 0.502, p < 0.001; Haigis: r2 = 0.450, p < 0.001) (Fig. 2A-2C).
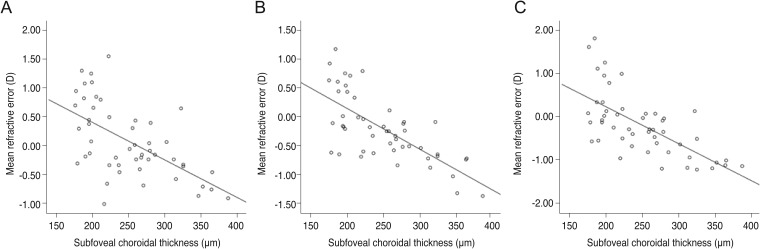
Scatterplots showing mean refractive error produced by (A) the SRK/II formula (r2 = 0.350, p ≤ 0.001, simple linear regression analysis); (B) the SRK/T formula (r2 = 0.502, p ≤ 0.001, simple linear regression analysis); and (C) the Haigis formula (r2 = 0.450, p ≤ 0.001, simple linear regression analysis) as measured with the IOLMaster Optical Biometer against subfoveal choroidal thickness. D = diopter.
To clarify the relationship between preoperative subfoveal CT and the amount of refractive error after cataract surgery, we counted the number of patients with the cutoff criteria of a subfoveal CT of 300 µm and a MAE value of 0.5 D. Using Pearson's chi-square method, patients with greater than or equal to 300 µm of CT were highly correlated with a higher MAE value of 0.5 D in the SRK/T and Haigis formula groups, which indicates the higher absolute value of the refractive error (odds ratio, 1.970; Fisher exact test, p = 0.014 for SRK/T; odds ratio, 2.364; Fisher exact test, p = 0.005 for Haigis) (Table 7).
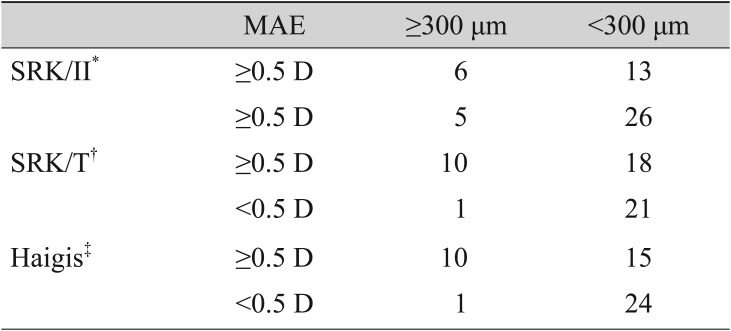
Relationship between preoperative choroidal thickness and MAE
Subgroup analysis of preoperative and postoperative subfoveal CT and postoperative refractive error
We conducted a subgroup analysis of 16 patients who underwent postoperative subfoveal CT evaluation. In subgroup analysis, postoperative subfoveal CT was significantly thinner than preoperative subfoveal CT (preoperative group, 258.88 ± 66.03 µm; postoperative group, 254.81 ± 61.88 µm; p = 0.024).
Using the MREs calculated by the three formulas, univariate regression analysis showed that a larger degree of postoperative reduction of subfoveal CT was significantly associated with a more significant amount of myopic shift after cataract surgery in all formulas (SRK/II: β = 0.579, p = 0.0.019; SRK/T: β = 0.818, p < 0.001; Haigis: β = 0.619, p = 0.011). In addition, the association between postoperative subfoveal choroidal thinning and postoperative MRE showed a more significant myopic refractive shift after cataract surgery (SRK/II: r2 = 0.335, p = 0.019; SRK/T: r2 = 0.669, p < 0.001; Haigis: r2 = 0.384, p = 0.011) (Fig. 3A-3C).
Scatterplots showing mean refractive error produced by (A) the SRK/II formula (r2 = 0.335, p = 0.019, simple linear regression analysis); (B) the SRK/T formula (r2 = 0.669, p ≤ 0.001, simple linear regression analysis); and (C) the Haigis formula (r2 = 0.384, p = 0.011, simple linear regression analysis) as measured with IOLMaster Optical Biometer against the difference between preoperative and postoperative subfoveal choroidal thickness. D = diopter.
Discussion
Although some controversy remains, the choroid was found to be thicker in PAC eyes in several publications [242526]. In our previous paper, we compared the parameters obtained by AS-OCT between acute angle-closure eyes and fellow eyes and showed that the most significant difference was increased LV [26]. In our acute angle-closure cases, we observed incremental swelling of the peripheral choroid in three cases out of 36 [27]. If choroidal swelling contributes to the angle-closure mechanism and subsides afterward, it may change the refractive outcome. In the current study, all three IOL calculation formulas showed that increased CT before surgery was associated with a significant myopic shift in postoperative refractive evaluation. If choroidal swelling subsides and the choroid thins postoperatively, the affected eyes may become more myopic. Unfortunately, we could not assess the postoperative CT in all cases; therefore, this hypothesis provides direction for and warrants further investigation.
In contrast to those for CT, our data showed that increased LV and shallow ACD were associated with a hyperopic shift, which is concordant with the findings of previously published work. Eyes with increased LV usually have zonular laxity; thus, IOL position can be moved posteriorly in comparison with presurgery status [1028]. When we compared several IOL calculation formulas, both the SRK/T and Haigis formulas showed a hyperopic shift, while the SRK/II formula showed a myopic shift. The SRK/T and Haigis formulas did not provide significantly different results from each other. Usually, the reduction of IOP after cataract surgery in PAC eyes produces a hyperopic shift due to a shortening of the anteroposterior length. Additionally, deepening of the anterior chamber and subsequent posterior positioning of the IOL may also induce hyperopic refractive change [1029].
This study has several limitations. Its relatively small sample size may have affected statistical power; thus, the results should be interpreted with caution. We analyzed the three most commonly used IOL calculation formulas, but there are other formulas that could have also been assessed and may have provided different answers. Finally, our cohort included both eyes that had undergone LPI and eyes that had not. While LPI changes the configuration of the anterior segment, ACD and LV measurements, which were used in our analysis, were shown to be unaffected by LPI in previous studies [2030].
In summary, this study demonstrated that preoperative subfoveal CT and difference between pre- and postoperative subfoveal CT influenced post-cataract surgery refractive outcome in eyes with PAC. Specifically, increased preoperative CT and postoperative CT reduction were associated with a myopic shift. These observations suggest that the evaluation of CT before surgery is needed for more accurate postoperative refractive outcome. Further, the selection of appropriate IOL calculation formula(s) should be considered to optimize visual and refractive outcomes in cataract surgery in PAC patients.
Notes
Conflict of Interest: No potential conflict of interest relevant to this article was reported.