Intraocular Lens Power Calculation after Refractive Surgery: A Comparative Analysis of Accuracy and Predictability
Article information
Abstract
Purpose
To compare the accuracy of intraocular lens (IOL) power calculation using conventional regression formulae or the American Society of Cataract and Refractive Surgery (ASCRS) IOL power calculator for previous corneal refractive surgery.
Methods
We retrospectively reviewed 96 eyes from 68 patients that had undergone cataract surgery after keratorefractive surgeries. We calculated the formula with two approaches: IOL powers using the ASCRS IOL power calculator and IOL powers using conventional formulae with previous refractive data (Camellin, Jarade, Savini, and clinical history method) or without prior data (0, 2 and, 4 mm total mean power in topography, Wang-Koch-Maloney, Shammas, Seitz, and Maloney). Two conventional IOL formulae (the SRK/T and the Hoffer Q) were calculated with the single K and double K methods. Mean arithmetic refractive error and mean absolute error were calculated at the first postoperative month.
Results
In conventional formulae, the Jarade method or the Seitz method, applied in the Hoffer Q formula with the single K or double K method, have the lowest prediction errors. The least prediction error was found in the Shammas-PL method in the ASCRS group. There was no statistically significant difference between the 10 lowest mean absolute error conventional methods, the Shammas-PL method and the Barrett True-K method calculated with using the ASCRS calculator, without using preoperative data.
Conclusions
The Shammas-PL formula and the Barrett True-K formula, calculated with the ASCRS calculator, without using history, were methods comparable to the 10 most accurate conventional formulae. Other methods using the ASCRS calculator show a myopic tendency.
Since the 1980's, a number of keratorefractive procedures have introduced excimer laser treatment. In later decades, more and more patients who underwent keratorefractive surgery also underwent cataract surgery [1]. In a cataract operation, intraocular lens (IOL) power is calculated using corneal power, eye axial length and actual lens position prediction. Current third and fourth generation formulae, such as SRK/T, Hoffer Q, Holladay or Haigis, have been used extensively. However, in patients with previous refractive surgery, the use of standard IOL power calculation formulae frequently results in undercorrection, thus yielding significant hyperopic error [1234].
There are three main reasons for errors that can occur when calculating IOL power in patients with previous cor-neal refractive surgery. One is instrument error when measuring keratometric values. Because the anterior surface of the cornea becomes flatter after keratorefractive surgery, conventional keratometry and corneal topography provide incorrect corneal power values and tend to overestimate corneal power [345]. Second, the corneal refraction index is incorrect in corneas that have undergone refractive surgery. Because the relationship between the anterior and posterior corneal curvature is changed, the standardized index of anterior corneal keratometry (1.3375) for total corneal power calculation is not suitable for these patients [26]. Finally, formulation error is caused by effective lens position (ELP) prediction. ELP is calculated by the regression method using axial length and keratometric value, therefore the prediction value is altered after refractive surgery. However, the anterior chamber depth does not actually change.
Previous studies have reported numerous formulae for accurately calculating values for patients that have undergone refractive surgery. The clinical history method, proposed by Holladay and modified by Hoffer [7], estimated corneal power after refractive surgery. The double K method, proposed by Aramberri [8], provided a solution for calculating the ELP with preoperative-K (keratometric value before refractive surgery) and postoperative-K (keratometric value after refractive surgery) values. Camellin and Calossi [9], Savini et al. [10], and Jarade and Tabbara [11] reported that IOL calculation with the double K method, using previous data, was more accurate. In comparison, IOL power calculation regression formulae using postoperative keratometric data only were designed by Seitz and Langenbucher [12], Savini et al. [13], and Shammas et al. [14] because of inaccuracy and low availability of preoperative keratorefractive data. Moreover, Wang et al. [15] and Smith et al. [16] proposed methods that used topographic data. Recently, Barrett [17] developed the True-K formula, which is a modified version of the Barrett universal II formula and can calculate IOL power without preoperative data. Despite numerous publications on improved IOL calculation methods or determination of post-keratorefractive corneal power, there is currently no gold standard for IOL calculation that is applicable to all refractive patients.
Recently, the development of the American Society of Cataract and Refractive Surgery (ASCRS) IOL power calculator has allowed IOL calculation for prior myopic vision correction surgery to be more comfortable and efficient. Therefore, we comparatively analyzed the prediction errors of IOL power calculation using the ASCRS IOL power calculator and conventional regression formulae with the single/double K-method using various methods to estimate K.
Materials and Methods
This study adhered to the tenets of the Declaration of Helsinki for the use of human participants in biomedical research and was approved by the institutional review board in Seoul National University Hospital (1206-073-414). We retrospectively analyzed patients who had previously undergone photorefractive keratectomy, laser-assisted sub-epithelial keratomileusis, or laser-assisted in situ keratomileusis for myopia and who underwent cataract surgery from January 2003 to June 2015. Medical records for 96 eyes of 68 patients were reviewed. Patient demographics, such as age, gender, laterality of the operated eye and the type of laser vision correction surgery, all clinical data required for IOL power calculation (postoperative and/or preoperative kerato-refractive values and axial length), as well as preoperative and postoperative best-corrected visual acuity were collected. Exclusion criteria in-cluded trauma, corneal opacity, severe dry eye, extreme keratometric values (sim-K <40 diopter or >47 diopter before refractive surgery) and intraoperative complications (both refractive surgery and cataract surgery).
Autokeratometry (KR-7100; Topcon, Tokyo, Japan), IOL Master (IOL Master; Carl Zeiss, Jena, Germany), and topography (Orbscan IIZ, Bausch & Lomb, Rochester, NY, USA; Atlas 9000, Carl Zeiss) were used for preoperative corneal power measurements. Axial length measurement was obtained by IOL Master with partial coherence tomography, and in unavailable cases measured by A-scan (Ultrasonic Biometer, Model 820; Humphrey Instrument, Dublin, CA, USA).
Two surgeons (MKK and JYO) performed all cataract surgeries by standard phacoemulsification with lens implantation. AcrySof SN60WF (Alcon, Fort Worth, TX, USA), AcrySof SA60AT (Alcon), AcrySof MA60BM (Alcon), Sensar AR40e (Allergan, Irvine, CA, USA), and Tecnis ZCB00 (Abbott, Abbott Park, IL, USA) IOLs were implanted.
Several methods were used to calculate IOL power to measure the postoperative K combined with two conventional IOL power formulae (SRK/T and Hoffer Q), using the single K and double K methods. In the double K formula, 43.5 was used for pre-K when preoperative data were not available for pre-K [7]. If patient corneal keratometric values before refractive surgery were available, the Camellin, Jarade, Savini, and clinical history method was used. If no preoperative refractive values were available, IOL power was calculated using 0, 2, and 4 mm total mean power in the topography, Wang-Koch-Maloney, Shammas, Seitz, and Maloney methods. Moreover, IOL power calculation provided by the ASCRS IOL power calculator was performed by using the Haigis-L formula as well as the Wang-Koch-Maloney method, Shammas method with the Shammas-PL formula, and Barrett True-K formula without using preoperative data (http://iolcalc.org/) [18]. Table 1 shows IOL power calculation methods.
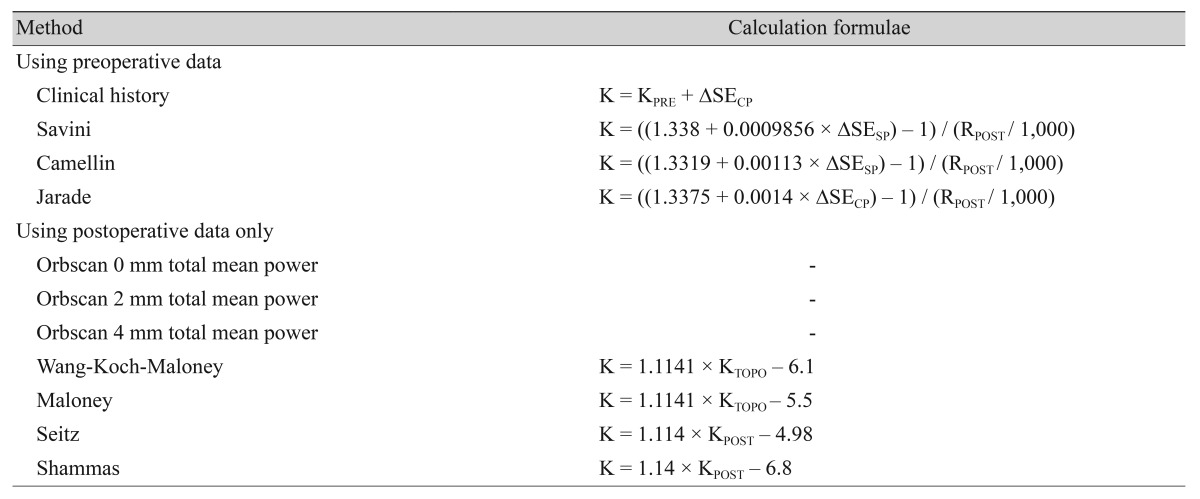
Postoperative keratometric values (K) after laser vision correction surgery
One month after cataract surgery, refractive error was measured with an autorefractor (KR-7100, Topcon). All data were repeatedly measured until they were sufficiently reliable to obtain an accurate average value. The refractive error was converted to a spherical equivalent and compared to expected IOL power using the following steps:
ΔR = Ractual – Rexp
ΔR: IOL prediction arithmetic error
Ractual: Refractive error that was attained 1 month after cataract surgery, converted to spherical equivalent
Rexp: Expected refraction that was calculated by IOL calculation formula
A positive ΔR value indicated that the actual refraction had more hyperopic shift than the predicted refraction. However, a negative value indicated that there was more myopic shift.
Mean arithmetic refractive error (MARE) and mean absolute error (MAE) were calculated as described below. The MAE was defined as the absolute value of the difference in the refractive error using mean absolute error, which was also defined as the “absolute prediction refractive error.”
MARE = Σ(Ractual – Rexp) / n
MAE = Σ|Ractual – Rexp| / n
n: number of patients
The correlation of MARE, according to the axial length, was assessed using linear regression analysis with a coefficient of determination (r2). A p-value <0.05 was considered statistically significant. Statistical analysis was performed with SPSS ver. 20.0 software for Windows (IBM Corp., Armonk, NY, USA). Our study design is summarized with a schematic illustration (Fig. 1).
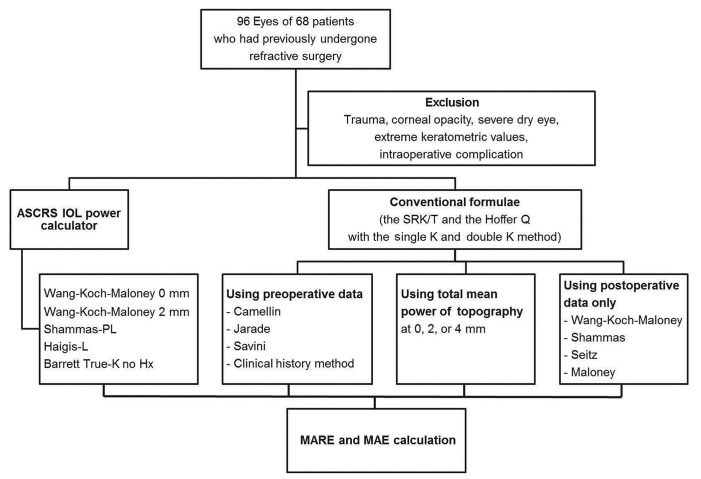
A schematic study design illustration. ASCRS = American Society of Cataract and Refractive Surgery; IOL = intraocular lens; MARE = mean arithmetic refractive error; MAE = mean absolute error; Barrett True-K no Hx = Barrett True-K method without using preoperative data.
Results
Ninety-six eyes from 68 patients were analyzed. The mean age of patients at cataract operation was 53.1 ± 10.3 years and 47 patients (69%) were female. Out of a total 96 eyes, nine eyes from eight patients (9%) underwent photorefractive keratectomy; 86 eyes from 59 patients (90%) underwent laser-assisted in situ keratomileusis; and one eye underwent laser-assisted sub-epithelial keratomileusis. The mean of best-corrected logarithm of the minimum angle of resolution visual acuity was 0.61 ± 0.40 before cataract surgery a nd 0.20 ± 0.17 at postoperative 1 month. Every patient had improved vision after cataract surgery. Of the 96 eyes, 28 eyes had available data before refractive surgery, while 68 eyes did not have preoperative data available. Patient demographics and clinical data are summarized in Table 2.

Patient demographics and clinical characteristics
For the analysis, we first examined the MARE and MAE with various methods to determine which method would be accurate. The mean MARE value determined using all conventional formulae was –0.15 ± 1.38. The mean MAE value using all conventional formulae was +1.07 ± 0.88. In the conventional formulae group, the ten most accurate methods that calculated the MAE as less than 0.75 diopter were the Jarade method applied in the Hoffer Q formula with the single-K or double-K method; the Seitz method applied in the Hoffer Q formula with the single-K or double-K method as well as the SRK/T formula with the double-K method, the Shammas method with the single-K method applied in the SRK/T or Hoffer Q formula; the total mean power at 2 mm in the topography method applied in the SRK/T formula with the single-K method; the Wang-Koch-Maloney method applied in the Hoffer Q formula with the single-K method and the Maloney method applied in the SRK/T formula with the double-K method (Figs. 2A-2C and 3A-3C). There was no statistically significant difference between the 10 lowest MAE conventional methods. In the ASCRS group, the Shammas-PL, the Barrett True-K no history, and the Haigis-L formulae had the lowest MAE and MARE (Figs. 4 and 5). The Shammas-PL method and the Barrett True-K no history method using the ASCRS calculator was not statistically significant different from the 10 lowest MAE conventional formulae, but there was a difference in the MAE between other formulae when the ASCRS calculator was used. Moreover, the MARE values determined with those formulae (Haigis-L and Wang-Koch-Maloney method) showed a myopic tendency.

Box plot of mean absolute error (MAE) of intraocular lens power prediction with various conventional methods. (A) Using preoperative data, (B) total mean power of topography, (C) no keratorefractive history before refractive surgery. Round mark (○) means outlier values which are between one and a half and three box lengths; asterisk (*) means extreme values which are more than three box lengths. DoubleK = the SRK/T formula with the double-K method; HoQDoubleK = the Hoffer Q formula with the double-K method; HoQSingleK = the Hoffer Q formula with the single-K method, SingleK = the SRK/T formula with the single-K method; Topo mean 0, 2, 4 mm = the total mean power at 0, 2, 4 mm in the topography method; W-K-M = the Wang-Koch-Maloney method.

Box plot of mean arithmetic refractive error (MARE) of intraocular lens power prediction with various conventional methods. (A) Using preoperative data, (B) total mean power of topography, (C) no keratorefractive history before refractive surgery. Round mark (○) means outlier values which are between one and a half and three box lengths from either end of the box; asterisk (*) means extreme values which are more than three box lengths from either end of the box. DoubleK = the SRK/T formula with the double-K method; HoQDoubleK = the Hoffer Q formula with the double-K method; HoQSingleK = the Hoffer Q formula with the single-K method; SingleK = the SRK/T formula with the single-K method; Topo mean 0, 2, 4 mm = the total mean power at 0, 2, 4 mm in the topography method; W-K-M = the Wang-Koch-Maloney method.
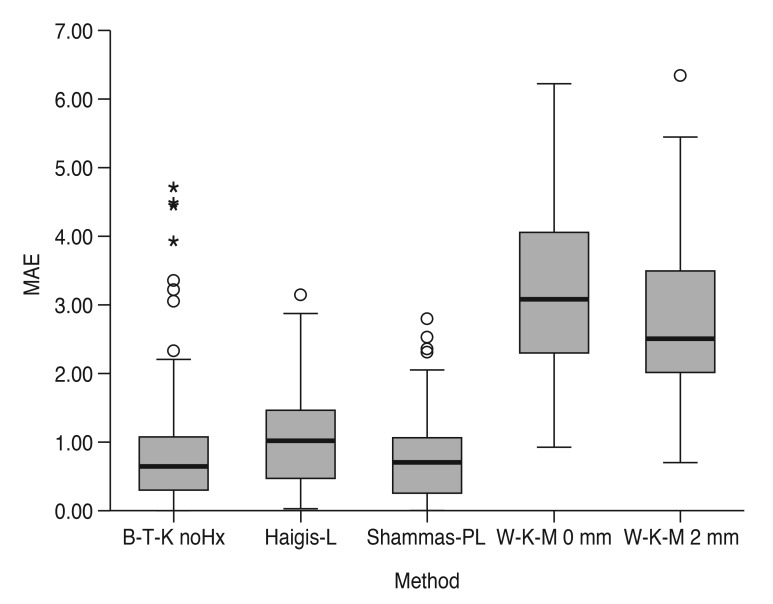
Box plot of mean absolute error (MAE) of intraocular lens power prediction with the American Society of Cataract and Refractive Surgery calculator. Round mark (○) means outlier values which are between one and a half and three box lengths; asterisk (*) means extreme values which are more than three box lengths. B-T-K noHx = Barrett True-K method without using preoperative data; W-K-M 0, 2 mm = Wang-Koch-Maloney method using topographic K at 0, 2 mm.
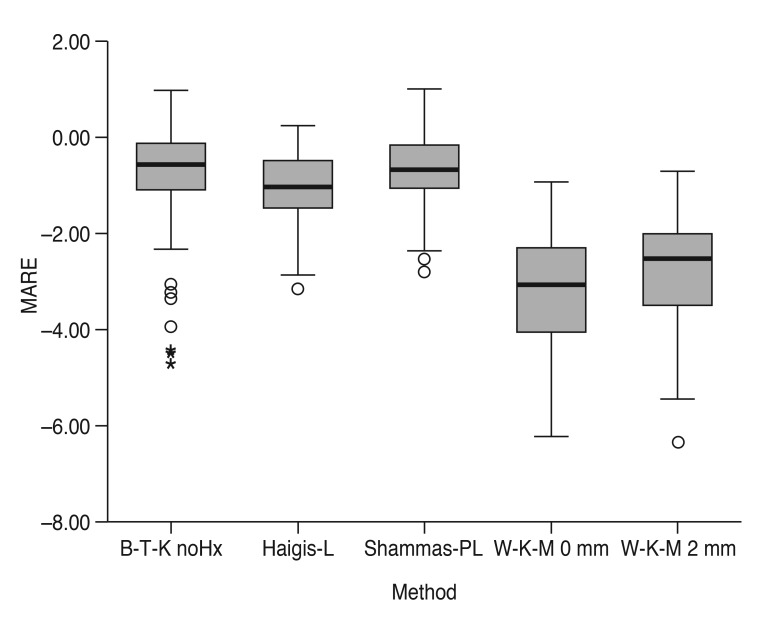
Box plot of mean arithmetic refractive error (MARE) of intraocular lens power prediction with the American Society of Cataract and Refractive Surgery calculator. Round mark (○) means outlier values which are between one and a half and three box lengths from either end of the box; asterisk (*) means extreme values which are more than three box lengths from either end of the box. B-T-K noHx = Barrett True-K method without using preoperative data; W-K-M 0, 2 mm = Wang-Koch-Maloney method using topographic K at 0, 2 mm.
Second, we evaluated the coefficient of determination (r2) of the MARE linear regression, according to the axial length and its significance based on various methods (Tables 3,4,5,6). In the conventional methods, the Camellin applied in the Hoffer Q with the double K or single K and the Savini applied in the Hoffer Q with the double K or single K showed a more hyperopic tendency for the MARE values when the axial length was longer. None of the other methods displayed any axial length dependent change of MARE values. All of the calculated ASCRS formulae, with the exception of the Barrett True-K no history method, did not indicate axial length dependent MARE. The Barrett True-K no history method showed a more myopic tendency for the MARE values when the axial length was longer.
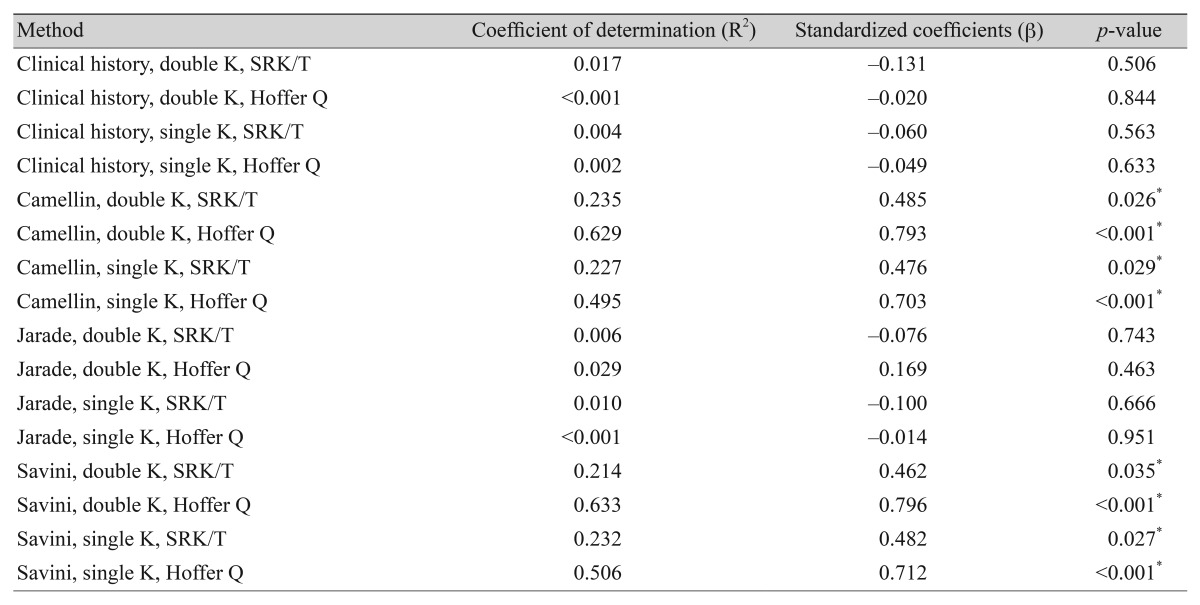
Linear regression of mean arithmetic refractive errors correlated with the axial length (methods using preoperative data)
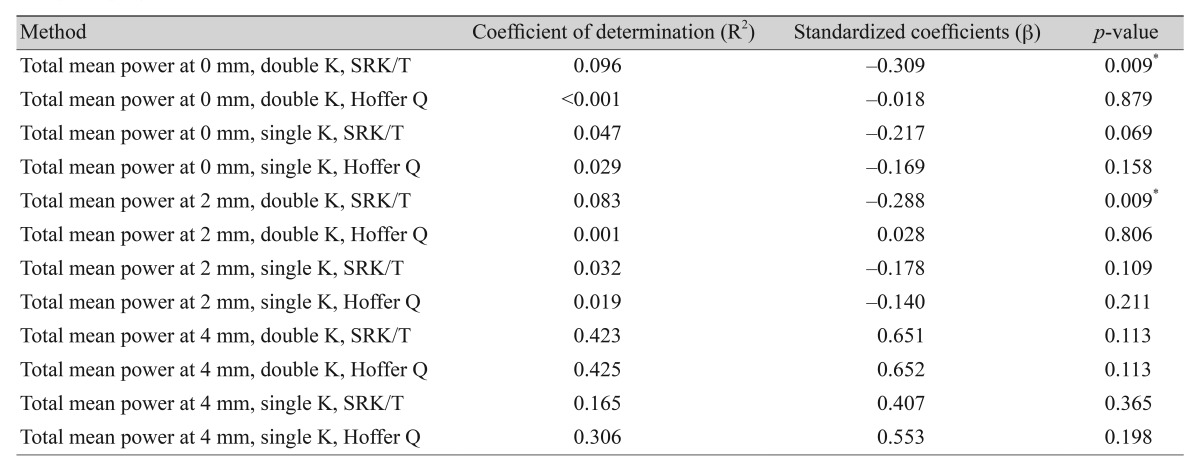
Linear regression of mean arithmetic refractive errors correlated with the axial length (methods using total mean power of topography)
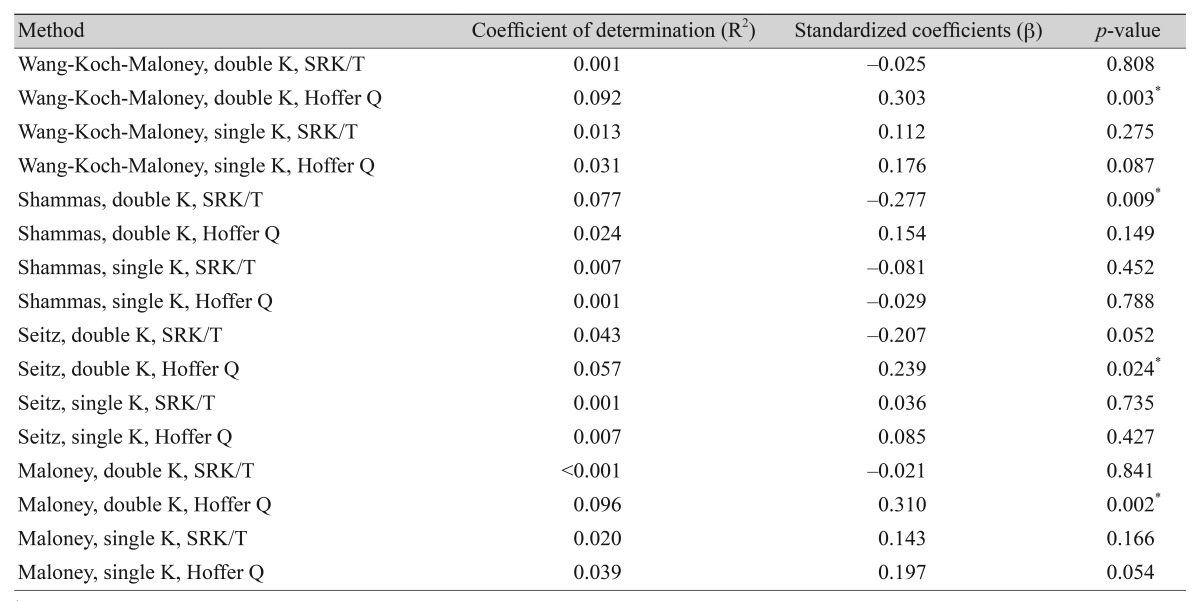
Linear regression of mean arithmetic refractive errors correlated with the axial length (methods using postoperative data only)
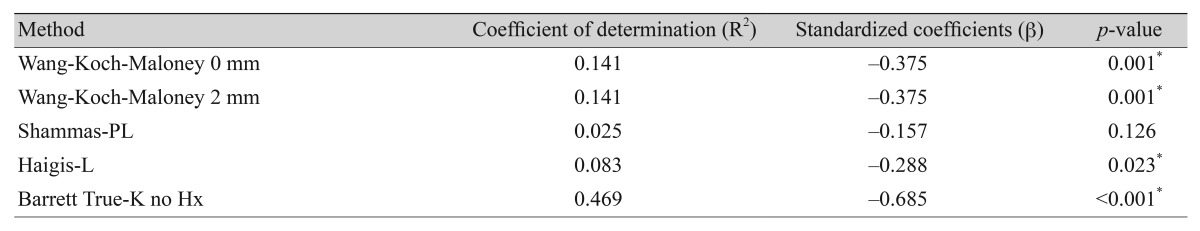
Linear regression of mean arithmetic refractive errors correlated with the axial length (the ASCRS calculator formulae)
Discussion
Our study determined that the most reliable method for identifying the least prediction errors was the Jarade method applied in the Hoffer Q formula when previous refractive data is available. Several methods can be used to calculate IOL power when preoperative data are not available, but only four methods, the Camellin, Jarade, Savini, and clinical history method, were comparatively analyzed because there were too many errors in the other methods. If there is no clinical history, the Seitz method applied in the Hoffer Q formula and the Shammas method with the single K method were the most accurate ways to calculate IOL power. In the ASCRS group, the Shammas-PL formula and the Barrett True-K formula were comparable to the most reliable conventional method without using clinical history.
Our study also showed that the clinical history method using pre-K data was no longer the standard formula for predicting IOL power in patients who underwent refractive surgery because there were higher errors with the Savini, Camellin, and clinical history methods. Therefore, the Shammas-PL formula and the Barrett True-K formula can be applied without using prior data and can be alternatives because the results present less than 1 diopter of the MARE and MAE. In addition, it is better for most practitioners that the ASCRS calculator can be applied without prior data (the Shammas-PL and the Barrett True-K formula) and is a reliable option, although pre-refractive surgery information is not available. Chen et al. [19] reported that meta-analysis data showed significantly better results with the Shammas method, without using preoperative data, compared with the Haigis-L method, for prediction error; the clinical history method and Feiz-Mannis method, which required historical data, were less accurate in their predictions. Abulafia et al. [20] also reported that the Barrett True-K formula was an alternative method that was available on the ASCRS calculator and could be applied to predict the IOL power in patients with previous refractive surgery. Our data are consistent with Chen's meta-analysis data and Abulafia's data. However, in the case of the Barrett True K formula, our data showed a refractive error that was greater than 1 diopter when the axial length was longer than 30 mm.
In comparison, Savini et al. [10] reported that the double K clinical history method, using the SRK-T or Holladay 1 formula, was more accurate for predicting IOL power after post-refractive surgery. After additional research, Savini et al. [13] insisted that the Seitz/Speicher/Savini, Savini, Masket, and Camellin/Calossi method, using the double K SRK-T formula, and the Shammas method with the Shammas PL formula, was the best approach for obtaining an accurate IOL power prediction because the results showed less than 1 diopter of MAE. However, Wang et al. [15] suggested that the double K method (SRK-T, Holladay, and Hoffer Q), and the corneal value derived from the adjusted effective refractive power, was the most accurate method, and that Shammas and Shammas [21] reported the least prediction error when the Shammas method with the Shammas-PL formula was applied. Our data are partly consistent with the later report by Shammas et al., which presents the Shammas-PL formula as a reliable option.
One of the reasons for the discrepancy between the reports could be the different axial lengths in various studies. The mean axial length was 25.4 ± 1.1 mm in the study by Savini et al. [10], and it was 27.84 ± 1.90 mm in the later report by Savini et al. [13]. The mean axial length was 26.0 ± 2.1 mm in patients in the study by Wang et al. [15], and it was 27.19 ± 2.5 mm in the study by Shammas and Shammas [21]; whereas the mean axial length was 28.1 ± 2.4 mm in our study. A high myope could affect error calculations and extrapolate the ELP even after adjusting with the double K method. Because the lens position does not change after refractive surgery, the double K method, which uses the pre-K value to estimate the ELP, is theoretically more correct. However, the IOL prediction is based on the axial length and corneal power. In regression methods, the depth of the anterior chamber or ELP is not obtained from the actual measurement but it is assumed for the IOL prediction. Considering the eye-model and regression data, the double K method, which estimates the depth of the anterior chamber (or ELP) using pre-K values, and the corneal refractive power that uses post-K values, tends to calculate more myopic IOL prediction in the higher myopes than the single K method. However, our study showed that the IOL prediction error estimated from most of the formulae was not dependent on the axial length regardless of the single K or double K method.
The other cause of the discrepancy between the reports might be whether the IOL that had been used in the study was three-piece or single piece which can affect the ELP. Although most of the published papers did not specify which type of IOL had been used, it could be assumed that previous studies tended to use a three-piece IOL, and more recent studies might have used a single piece IOL. Our study included both single piece and three-piece IOLs which could have introduced some discrepancies, compared with the outcomes from previous studies.
This study was limited because of the retrospective study design and relatively long study period of 12 years. However, only 11 eyes (11.5%) of seven patients underwent cataract surgery in the first half of the study period (from 2003 to 2009), and the rest of the 85 eyes (88.5%) of 61 patients underwent cataract surgery from 2010 to 2015. Therefore, the relatively long study period limitation likely has a minimal effect. The other limitation was that the 1-month follow-up refraction values were obtained by autokeratometry. The 1-month follow-up refraction is the most important value for accurately evaluating the IOL power calculation. To avoid every device error, a manifest refraction measurement would have been optimal. Therefore, we measured repeatedly until sufficiently reliable and accurate data was obtained.
In conclusion, the Jarade method or the Seitz method, applied in the Hoffer Q formula with the single K or double K method, are the most reliable methods for calculating IOL power after keratorefractive surgery. In addition, the Shammas-PL formula and the Barrett True-K formula, without using preoperative data, computed with the ASCRS calculator are considered comparable methods to the 10 most accurate conventional formulae. Other methods that use the ASCRS calculator showed a myopic tendency.
Notes
Conflict of Interest: No potential conflict of interest relevant to this article was reported.