

Visual function is incomplete at birth and typically develops during the early days of life [1]. Although the visual acuities of preverbal children may be quantitatively evaluated using preferential looking techniques, such as Teller acuity cards (TAC) [2], visual evoked potential, or optokinetic nystagmus, it is a difficult process [3]. Preverbal children tend to be uncooperative and cannot appropriately express their problems. In order to circumvent these issues, we have attempted to develop a visual acuity test that is easily performed and correlates well with the established visual acuity test. The rationale behind our test was that children tend to have interest in moving targets and possess the ability to concentrate on targets. In order to create a reliable visual acuity test for preverbal children, a computerized visual acuity test named the SNU dot visual acuity test (Seoul National University, Seoul, Korea) was developed. The purpose of this study was to investigate the efficacy of a visual acuity test in preverbal children by comparing visual acuities obtained using the SNU visual acuity test with those obtained using TAC.
Materials and Methods
Design of study
A prospective study was undertaken following the tenets of the Declaration of Helsinki to investigate the results of Teller visual acuity and SNU dot visual acuity tests. Approval from the ethics committee for human studies of Seoul National University Hospital Clinical Research Institute was granted for the study. We used data obtained from both eyes of each participant. The main outcome measures were Teller visual acuity (Stereo Optical, Chicago, IL, USA) and SNU dot visual acuity.
Study participants
Between January and May 2006, 56 children (30 boys and 26 girls) from two nurseries were recruited for this study. Children varied in age from 12 to 60 months (mean age, 41.0 ± 12.6 months). Seven children were aged less than 24 months, 11 were between 25 and 36 months, 21 were between 37 and 48 months, and 17 were between 49 and 60 months. Parents of the children in the two nurseries were offered the opportunity to participate. All study participants underwent ophthalmologic examinations, including motility testing and (for verbal patients) measurement of best-corrected visual acuity. Fundus examination was not performed. The children who failed the eye screening test were referred to the eye clinic for further ophthalmic examination. Children were subjected to monocular testing for each eye, while the other eye remained patched. Fixation behavior was used in place of recognition visual acuity testing in preverbal children. Children with conditions that seemed to have no impact on visual acuity, such as conjunctivitis or mild ptosis, were included. Children with neurologic and developmental disorders, strabismus or eye movement abnormalities, or who could not fix and follow the target were excluded. Children were tested using the Teller visual acuity test and SNU dot visual acuity test. The interval between the two tests was more than 20 minutes and the order was random.
Teller visual acuity test
All of the children underwent visual acuity testing using TAC [4,5]. TACs have high contrast black and white gratings printed in a square patch on a plain gray background of equal average luminance. A standard set of 16 cards spans a frequency range from 0.32 to 38 cycles/cm. The luminance of the screen was set within 400 to 500 lux (equivalent luminance of 130 to 160 cd/m2) before visual acuity testing began. The TACs were held at specified distances; e.g., 38 cm for 0 to 6 month old children, 55 cm for 7 month to 3 year old children, and 84 cm for older children. The testing room was cleared of all visually distracting objects, and the tester was alert to misleading fixations on the edges of the cards where the tester's hands were visible. The patient was either held or seated alone and was facing the tester at the appropriate distance from the acuity cards. Based on a variety of cues including fixation, pointing, and verbalization, the tester made a decision as to whether the patient could see the grating.
Grating spatial frequency was increased or decreased in a stepwise fashion depending on child's response. The tester's task was to judge visual acuity based on behavioral reactions e.g., eye and head movements, pointing gestures, and the most important guide, initial eye movement. TACs were presented three times. The presenter, who was unaware of the correct location of the grating, reversed the left-right positioning after each presentation. Child responses, such as consistent/inconsistent observing or "refusal to look," were noted. The tester confirmed the location of the grating on a card only after making a definitive judgment of the child's response. The highest spatial grating that generated a consistent look was judged as the visual acuity of the individual.
SNU dot visual acuity testing
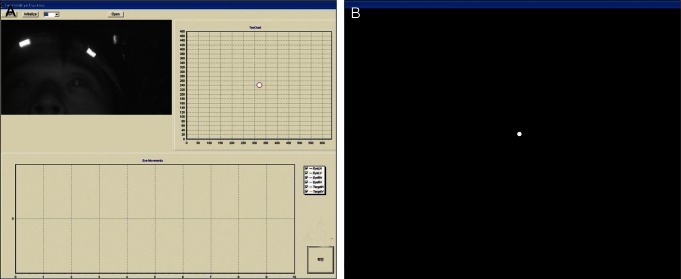
Children were seated in a comfortable chair or on a teacher's lap at a measured distance of 55 cm from a 43cm display monitor, so that the stimulus subtended a total visual angle of 20°. The test room was darkened, except for the light emitted from the test equipment. Testing was performed monocularly using an adhesive occluder over the fellow eye. The right eye was tested first followed by the left eye. A circular dot 1 to 20 pixels in size with 50% contrast moving at a fixed velocity of 10 pixels/sec in a monitor with a black background was presented (Fig. 1B). Eye images were captured using an infrared charge coupled device (CCD) camera (1/3"; Sony, Tokyo, Japan) (Fig. 1A, top right) and then transferred to a computer using a frame grabber (Osprey-100; Viewcast, Dallas, TX, USA). Images with a 30 frames/sec refresh rate, 640 × 480 pixels, and infrared light emitting diodes (880 nm) were used to maintain a dark environment. Head movements were traced using two reflective material markers (Naturalpoint, Corvallis, OR, USA) positioned in a headband worn by the participant (Fig. 1A, left).
The relative positions of the two eyes were calculated from the marker position. Accurate pupil positions were obtained by analyzing images that included eye positions. Tracking markers were used to ensure that the computer handled the images efficiently. Pupil positions were located using the central point of retinal reflex from illumination [6]. Movements of eyes and dots were superimposed on a graph and then analyzed (Fig. 1A, bottom). The minimal diameter of a dot followed by a child was defined as the objective visual acuity and was compared with the Teller visual acuity. We evaluated SNU dot visual acuity via the fix and follow method by analyzing the graphs and point-out methods. The fix and follow method involves the examiner observing the eye movements of children visually following the target. If he or she failed to fix and follow or point out the target twice or more during three attempts, this was interpreted to mean that he or she could not see the dot. In these cases, we increased the size of the dot one step. If the participant succeeded in pointing out the target twice or more during three attempts, the dot size was decreased by one step. The point-out method involves telling the children to point out the dot on the screen with their fingers and move their finger as the dot moved.
Results
Ten eyes (8.9%) of six children failed to perform the Teller visual acuity test, and two eyes (1.8%) of one patient failed to perform the SNU dot visual acuity test due to lack of participant cooperation. The Teller visual acuity of the participants was 16.13 ± 8.57 cycles/degree on average, and the SNU visual acuity was 1.64 ± 0.83 pixels on average. The average Teller visual acuity was 10.58 ± 4.13 cycles/degree in children less than 24 months old, 10.60 ± 8.71 cycles/degree in children between 25 and 36 months of age, 17.61 ± 7.82 cycles/degree in children between 37 and 48 months of age, and 19.18 ± 8.00 cycles/degree in children between 49 and 60 months of age. Average SNU dot visual acuities were 2.80 ± 1.23 degrees in children less than 24 months old, 1.95 ± 0.69 degrees in children between 25 and 36 months of age, 1.44 ± 0.57 degrees in children between 37 and 48 months of age, and 1.68 ± 0.67 degrees in children 49 to 60 months of age. The Teller visual acuity and SNU dot visual acuity were significantly correlated (Pearson correlation test, r = -0.415, p < 0.001).
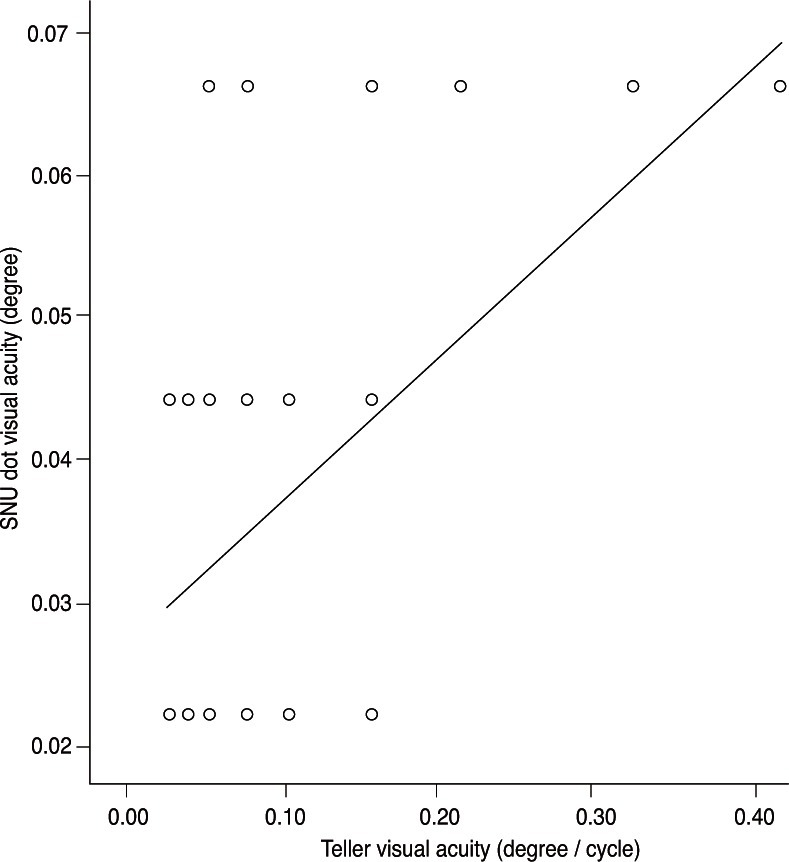
Visual angle degrees of Teller visual acuity were smaller than those of the SNU dot visual acuity and were significantly correlated with visual angle degrees as determined by the SNU dot visual acuity test (Pearson correlation test, r = 0.549, p < 0.001) (Fig. 2).
Discussion
Visual acuity tests can be divided into three types: detection visual acuity, resolution visual acuity, and recognition visual acuity [7]. The Teller acuity test, a resolution visual acuity test, is subjective in that the examiner must interpret the infant's gaze direction to one side (grating) or the other (blank). This form of testing requires experienced test personnel, considerable time, and can potentially overestimate visual function. Therefore, results from these tests should be interpreted with caution [8]. Hoyt suggested that the Teller acuity test showed a low sensitivity at detecting significant visual dysfunction during infancy [9]. Infants who score entirely within the normal range with TACs may later be identified as having significantly reduced visual acuity by using recognition visual acuity testing [9]. TACs also have the limitation that a child may not be interested in the test or may become easily bored, thus affecting the test results [10,11].
SNU dot visual acuity is a type of detection visual acuity that uses a moving target [12]. Even though the SNU visual acuity test is different from resolution visual acuity tests, including the Teller acuity test, we evaluated the efficacy of the SNU dot visual acuity test by comparing the results with those from the Teller acuity test, which is the most common clinical test used in children. In our study, we found a significant correlation between the Teller visual acuity and SNU dot visual acuity test, which is evidence of its efficacy as a visual acuity test in children. Compared to the Teller acuity test, the SNU dot visual acuity test is objective, does not require experienced test personnel, and may better retain participant interest because it uses a moving target. In fact, more children performed the SNU visual acuity test than the Teller visual acuity test.
Recently, many studies reported that children with amblyopia have trouble with motion tasks [13,14]. The amblyopes were severely impaired at detecting motion at fine spatial and long temporal offsets, corresponding to fine spatial scale and slow speeds [14]. Because the SNU dot visual acuity test uses moving targets, it may be more beneficial than traditional methods in detecting amblyopia and may detect amblyopia earlier.
Regarding the dot visual acuity, Kirschen et al. [15] reported that successively smaller dots were presented, and the smallest dot correctly identified twice was taken as the acuity threshold. The same group found that children responded to the test, and that visual thresholds were the same after comparing their visual acuity test with tumble E games. They suggested that the dot visual acuity method is rapid, inexpensive, and effective. This study was different from our computerized study in that they used an illuminated light box with printed black dots of different diameters, and we used a moving target. In the Kirschen et al. study [15], the child's task was to locate the dot, which could appear anywhere within the aperture, and touch it. The SNU visual acuity test uses a computerized moving target and monitors and analyzes the eye movement using an infrared CCD camera.
The purpose of our study was to develop a visual acuity test that can be used in infants or very young children who are not easily tested with resolution visual acuity tests. In our study, we confirmed that the SNU dot visual acuity test using a moving dot is effective; visual acuity with a moving dot could be correlated to resolution visual acuity. Moreover, technicians without extensive training can perform the SNU dot visual acuity test. The 97% testability rate attests to the ease and attractiveness of the SNU dot visual acuity test. The SNU dot visual acuity test appears to be at least equivalent in accuracy and applicability to TACs. The advantages of the present test are as follows: first, eyes recognize a moving target easier than a fixed target [16,17]. Therefore, we believe that the SNU dot visual acuity test would be probably useful for testing children with lower levels of attention and interest. Secondly, the SNU dot visual acuity test is easy to perform for both the examiner and examinee. Point-out is a very easy and accurate method. Almost all of the children participated if they could move their hands voluntarily. This test can be of benefit and is more applicable in preverbal children who are from 8 months old to 3 years old as they are curious about the moving target. Moreover, this test is not expensive because a common desktop computer and monitor can be used, and the results can be printed out. Thirdly, one pixel corresponds to 0.0221 degrees of visual angle at 55 cm. In this study, the visual angle of one pixel corresponded to 0.0526 degrees of Teller visual acuity, and thus the range of the devised test in terms of measurable visual acuity is substantial. We expressed the TAC results as "degrees per cycle" instead of the commonly used "cycle/degree" because the SNU dot visual acuity was expressed as "degree".
A disadvantage of the SNU dot visual acuity test is its lack of portability. Further investigation regarding a light and portable device is needed. As this is a preliminary study, we did not evaluate the test-retest reliability. In addition, we expressed the SNU dot visual acuity as cycles/degree, which is unique. Further study is needed to evaluate the test-retest reliability and to correlate cycles/degree to visual acuity.
In conclusion, the SNU dot visual acuity test correlated well with the Teller visual acuity and was applicable in more children than the Teller acuity test, which is a testament to its potential clinical applications. Further studies may be necessary with a larger number of children.
 PDF Links
 PubReader
 Full text via DOI
 Full text via PMC
 Download Citation
 Print
Print