Gene Expression Changes in a Rat Model of Oxygen-Induced Retinopathy
Article information
Abstract
Purpose
To identify altered patterns of retinal mRNA expression in a rat model of oxygen-induced retinopathy (OIR).
Methods
Sprague-Dawley rats from P2 to P14 were exposed to hyperoxia (80% oxygen) to induce OIR and then returned to normoxic conditions. Control rats were sustained in room air. Retinal gene expression between the rats of OIR and the controls was compared using cDNA microarray analysis. Reverse transcriptase polymerase chain reaction (RT-PCR) was used to verify the microarray results.
Results
Among a total of 12,731 cDNAs analyzed by mircroarray, 13 genes were strongly up- or down-regulated (>2-fold change over controls) in the OIR rats. We found a significant increase in expression of 10 genes (CaM-kinase II inhibitor; acidic nuclear phosphoprotein 32 family, member A; vascular endothelial growth factor; interferon α-inducible protein 27-like; similar to enthoprotin, epsin 4, clathrin interacting protein; nidogen [entactin]; tubulin, β5; fibrillin-1; spectrin β2; and stearoyl-coenzyme A desaturase 2) and a significant decrease in expression of 3 genes (myelin-associated oligodendrocytic basic protein, heat shock protein, and decorin) in OIR rats compared to controls.
Conclusions
We confirmed changes in expressions of various retinal genes in a rat model of OIR by microarray and RT-PCR. This study should contribute to the understanding of genetic indicators associeated with OIR.
Retinopathy of prematurity (ROP) is a retinal disease associated with the development of neovascularization and occurs primarily in premature infants of low gestational age and low birth weight [1]. The disease is thought to result largely from an aberrant retinal response to hyperoxia during supplemental oxygen therapy, compounded by functional retinal hypoxia as oxygen therapy is withdrawn [2]. While guidelines for management and treatment have recently been refined, it remains difficult to identify those infants susceptible to the progressive stages of ROP that is a leading cause of childhood blindness [3-5].
Animal models of oxygen-induced retinopathy (OIR) have been used for more than 40 years to yield insights into ROP. These models have been instrumental in advancing our understanding of the human disease, as well as the mechanisms of normal retinal microvascular development [3]. The normal process of retinal development is driven by the local tissue hypoxia that accompanies retinal growth and maturation [6,7]. As retinal oxygen demand exceeds supply via diffusion from the choroidal circulation, a range of hypoxia-inducible angiogenic factors are released which further drive retinal vasculature formation. Exposure of neonatal rats to hyperoxia increases the diffusion of oxygen from the choroidal circulation, thereby abrogating retinal physiological hypoxia and allowing retinal development to continue in the presence of an attenuated circulation [8]. When hyperoxic exposure is terminated and animals are returned to the normoxia of room air, the mature but poorly vascularized retina becomes acutely hypoxic and the resultant surge in angiogenic factor release leads to aberrant retinal vascularization that resembles ROP [9]. Recent studies in an OIR model have demonstrated the significant changes in the mRNA expression of vascular endothelial growth factor (VEGF), neuropilin 1, neuropilin 2, and mouse telomerase reverse transcription [10-12]. The purpose of this study was to identify altered patterns of retinal mRNA expression in a rat model of OIR and identify potential therapeutic treatment for the neovascularization that occurs in retinopathy.
Materials and Methods
Animals
Pregnant female Sprague-Dawley (SD) rats were purchased from Samtako (Osan, Korea). Rats were individually housed under an alternating 12-hour light/dark cycle and allowed standard rat chow and water ad libitum, in accordance with the Institutional Animal Care and Use Committee of Gyeongsang National University [10].
Oxygen-induced retinopathy rat model
To induce OIR, newborn SD rat pups were exposed to hyperoxia (80 ± 1.3% O2) with 2 hr/day in room air from P2 to P14 and then returned to normal conditions (room air, 21 ± 1.5% O2) from P14 to P20 as previously described. Control rats were maintained in room air. In our previous study, retinal damage in response to OIR peaked at P18 [13]. In the present study, all control rats were sacrificed at P18 and all OIR rats were sacrificed at P16, P18, and P20 to investigate the changes in the rat retinae of OIR rats compared to control rats.
Total RNA extraction, microarray experiments, and reverse transcriptase polymerase chain reaction
Total retinal RNA was isolated from OIR and control rats at P16, P18, and P20, as previously described [14]. Microarray analysis was performed on OIR rats sacrificed at P18 only, but to confirm the maximal response of these P18 rats, reverse transcriptase polymerase chain reaction (RT-PCR) was performed at P16, P18 and P20. To detect changes in retinal gene expression levels in OIR rats, cDNA microarray experiments were performed using a Platinum Biochip Rat 4.0K cDNA chip (GenoCheck Ltd., Ansan, Korea). cDNA was synthesized with reverse transcriptase (200 U; MMLV, Promega, Madison, WI, USA) and random hexamers [15]. Decorin-specific primers [5'-AAT CCC TTA CGA CCC TGA-3' (forward) and 5'-CGC CCA GTT CTA TGA CAA-3' (reverse)] were used to amplify DNA in a Gibco-BRL Life Technology thermocycler (Gaithersburg, MD, USA) for 2 minutes at 94℃, 1 minute at 60℃, and 2 minutes at 72℃ [14]. Glyceraldehyde-3-phosphate dehydrogenase mRNA levels were used as an internal loading control. Amplified cDNAs were collected after 30 cycles and resolved in 1.5% agarose gels [15]. Changes in retinal mRNA levels were measured in four independent tests.
Results
Gene-expression patterns in oxygen-induced retinopathy
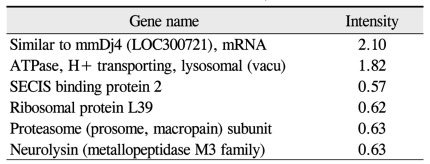
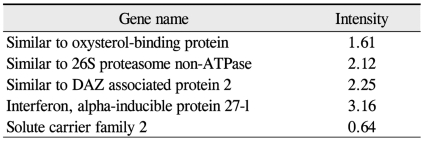
Preliminary data obtained by comprehensive microarray analysis of P18 rat retinae demonsrated reproducible gene-expression variations between OIR and control groups. Among a total of 12,731 cDNAs, 13 genes were signaficantly up- or down-regulated in OIR rats (> 2-fold change over controls). The total expressed signal intensities of 10 genes that included CaM-kinase II inhibitor α; acidic nuclear phosphoprotein 32 family, member A; VEGF; interferon α-inducible protein 27-like; similar to enthoprotin, epsin 4, clathrin interacting protein; nidogen (entactin); tubulin, β5; fibrillin-1; spectrin β2; and stearoyl-coenzyme A desaturase 2 were increased two-fold in OIR rats over the controls (Table 1). Conversely, the total expressed signal intensities of 3 genes that included myelin-associated oligodendrocytic basic protein, heat shock protein, and decorin were decreased two-fold in OIR rats compared to controls (Table 2).
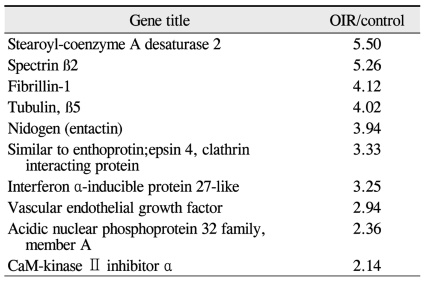
Up-regulated genes (>2-fold change) in oxygen-induced retinopathy (OIR) retinae over controls

Down-regulated genes (>2-fold change) in oxygen-induced retinopathy (OIR) retinae over controls
Among the cDNAs, genes associated with function were examined in greater detail. Functional classifications were identified as adhesion (Table 3), growth and differentiation (Table 4), metabolism, to include carbohydrate, energy, lipid, and nucleotide (Table 5), protein processing (Table 6), signal transduction (Table 7), structure (Table 8), transcription (Table 9), translation (Table 10), transport (Table 11), and others. The proportion of up- and down-regulated genes according to function was 25.6% in signal transduction, 20.8% in others, 18.6% in metabolism, 14.0% in extracellular matrix, 9.3% in growth and differentiation, 7.0% in transcription, and 4.7% in adhesion (Fig. 1).
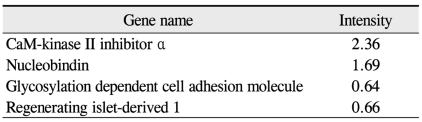
Adhesion genes (up- and down-regulated by 1.5-fold in oxygen-induced retinopathy retinae over controls)
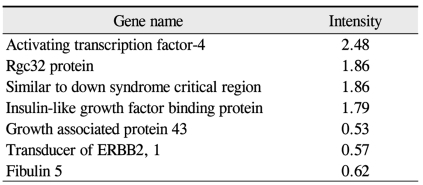
Growth and differentiation genes (up- and down-regulated genes by 1.5-fold in oxygen-induced retinopathy retinae over controls)
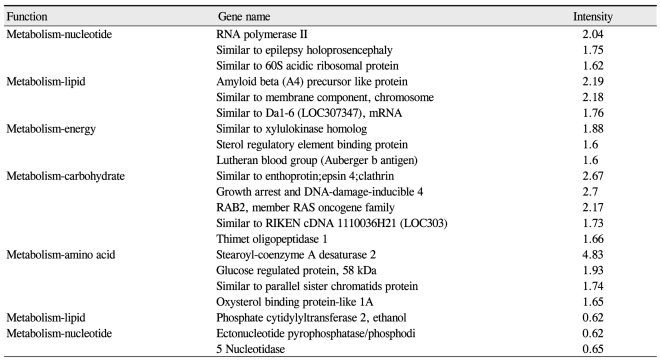
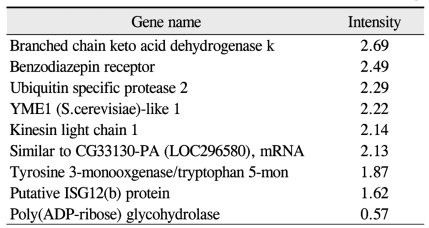
Metabolism genes (up- and down-regulated by 1.5-fold in oxygen-induced retinopathy retinae controls)
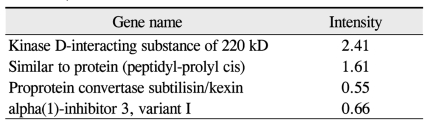
Protein processing genes (up- and down-regulated by 1.5-fold in oxygen-induced retinopathy retinae over controls)
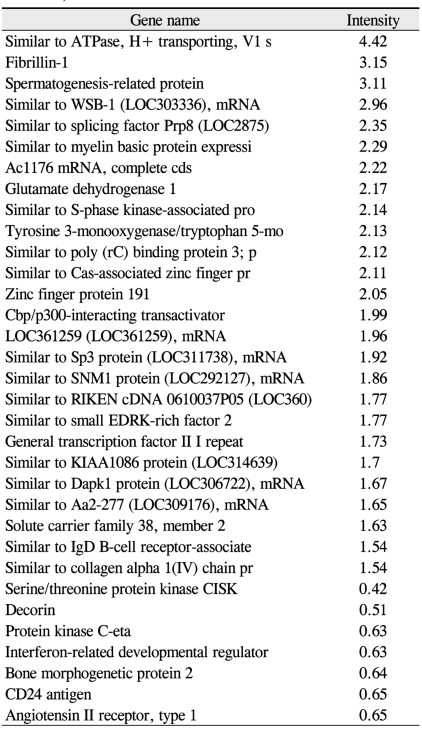
Signal transduction genes (up- and down-regulated by 1.5-fold in oxygen-induced retinopathy retinae over controls)
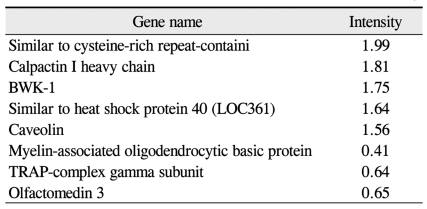
Structural genes (up-and down-regulated by 1.5-fold in oxygen-induced retinopathy retinae over controls)
Transcriptional genes (up-and down-regulated by 1.5-fold in oxygen-induced retinopathy retinae over controls)
Translational genes (up-and down-regulated by 1.5-fold in oxygen-induced retinopathy retinae over controls)
Transport genes (up-and down-regulated by 1.5-fold in oxygen-induced retinopathy retinae over controls)

Diagram of the proportions of genes up- and down-regulated by 1.5-fold in oxygen-induced retinopathy rats versus controls according to function.
Up-regulated expression pattern (Fig. 2) observed through microarray analysis for gene such as interferon α-inducible protein 27-like, VEGF, hypoxia inducible factor 1a, stromal cell-derived factor 1, intercellular adhesion molecule 1, glucose tolerance factor and annexin II and down-regulated gene expression pattern (Fig. 3) for genes such as heat shock protein and occluding were confirmed by RT-PCR.
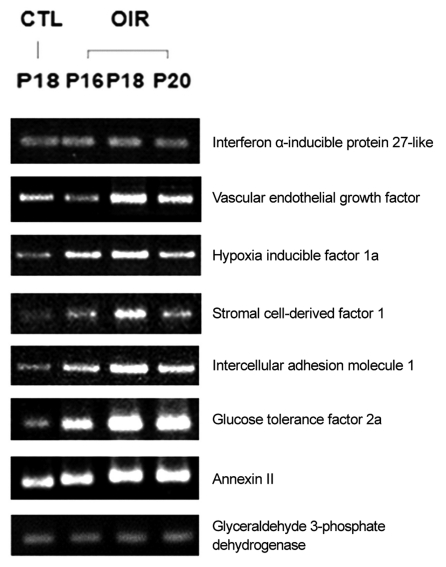
Up-regulated genes of oxygen-induced retinopathy (OIR) rat retina in reverse transcriptase polymerase chain reaction. CTL = control group; P = postnatal.
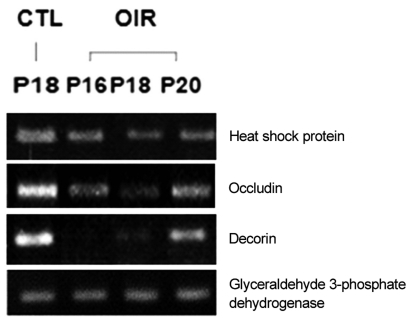
Down-regulated genes of oxygen-induced retinopathy (OIR) rat retina in reverse transcriptase polymerase chain reaction. CTL = control group; P = postnatal.
Discussion
A monitored, multicenter clinical trial provided strong evidence to support a causal association between early supplemental oxygen treatment and ROP. Inspired oxygen therapy does not account for all instances of this multifactorial disease, but it is widely accepted as a key agent in the pathogenesis of this condition [16].
OIR is a useful experimental model to study ROP [17] and is increasingly being used to identify the pathways and genes involved in retinal neovascularization [18-20]. The undervascularized state of the premature human retina closely resembles that of various newborn animals, for which retinal vascularization ordinarily occurs ex-utero [4].
In a majority of ROP cases, the clinical course progresses in a relatively uniform pattern, and is therefore likely to be controlled by specific molecules that are up- or down-regulated in a time-dependent fashion. Some molecules, such as VEGF and insulin-like growth factor-1 (IGF-1) are known to regulate angiogenesis in eyes with ROP [1].
van Wijngaarden et al. [2] revealed after 14 days of exposure to cyclic hyperoxia, expression of VEGF, Erythropoietin, VEGF receptor 2, Ang2, IGF-1, cyclooxgenase 2 and pigment epithelin-derived factor was significantly increased in the retinae of SD and Dark Agouti (DA) neonates compared with the F344 strain. The expression of a suite of genes known to be involved in angiogenesis was significantly higher in those strains (SD and DA) that are sensitive to oxygen induced retinopathy, compared with a strain (F344) that is relatively resistant.
Sato et al. [1] reported a comprehensive gene-expression profile in a murine model of OIR that suggested. An inflammatory response preceding angiogenesis resulted in distinct up-regulation from the beginning to the late stages of OIR due to the induction of retinal neovascularisation. Hypoxia inducible factor 1a (HIF-1a) and plasminogen were highly up-regulated, particularly at the beginning of OIR. The high level of HIF-1a reflects an adaptation to the relative hypoxia by HIF-1, a heterodimeric transcription factor.
In this study, the most prominent retinal gene expression change observed was 1.5-fold increased signal transduction in the retinae of OIR rats over the controls. This may reflect a strong adaptation to relative hypoxia and the increased activity needed for neovascularization. Oxygen stresses experienced in ROP trigger signaling through reactive oxygen species and lead to intravitreous neovascularization in an OIR rat model as reported by Byfield et al. [21]. We could not demonstrated an increase in expression inflammation mediated factors, since they were not included in our studies.
Ten genes were significantly up-regulated in OIR rat retinae (> 2-fold change over control) as determined by microarray analysis including VEGF, interferon α-inducible protein 27-like, and CaM-kinase II inhibitor. Whereas 3 genes including myelin-associated oligodendrocytic basic protein, heat shock protein, and decorin were down-regulated by 2-fold compared to controls.
This study had some limitations. There was no gene grouping comparisons of the early and late stages of OIR and the correlation between morphological and pathological changes in the rat retinae was not considered. All of the gene expression patterns involved in OIR have not been determined in this study; however, the data should presented contribute to a better understanding of the genetic implications surrounding. Further studies are necessary to establish the optimal conditions of pharmacological therapy to treat OIR.
Notes
No potential conflict of interest relevant to this article was reported.