

A change of color in the optic disc is one of the important parameters in diagnosing diseases such as toxic optic neuropathy, Leber's hereditary optic neuropathy, compressive optic neuropathy, and traumatic optic neuropathy. In glaucoma, a disc color change precedes glaucomatous visual field defects, and the optic discs of ocular hypertensive eyes show an increase in pallor but not in cupping [1,2].
Although the color of the optic disc possesses several diagnostic significances, objective measurement of the color of the optic disc is very difficult and complicated to perform. A number of researchers have reported a method to objectively measure the color of the optic disc [3-5]. However, the previously reported method was so complicated that it was not easy to analyze the results and apply them to clinical practice.
ImageJ is a Java-based image-processing and analysis program that was created by the National Institute of Health. This program is already available as freeware and is widely used in various studies [6]. Examples of biologic image analysis using ImageJ include area calculation, particle counting, DNA length measurement, dot blot analysis, optic density calibration, and density histogram creation. While ImageJ is a well-known and useful tool in biology image analysis, few reports have used ImageJ for disc color analysis so far.
The purpose of this study was to introduce ImageJ as a new method to analyze the color of the optic disc and to evaluate its reproducibility as an objective tool in analyzing optic disc color.
Materials and Methods
Participants
Eligibility criteria included normal participants of 112 pairs of eyes (112 patients) recruited from patients referred due to glaucoma suspicion from March 2008 to August 2008 at an urban tertiary-care hospital. They had normal intraocular pressure (<20 mmHg), normal findings in retinal nerve fiber layer photography, which showed no focal wedge-shaped defects or diffuse retinal nerve fiber layer loss, and normal and reliable results upon visual field testing. One eye from each patient was selected randomly to be analyzed in this study. Exclusion criteria included a best-corrected visual acuity worse than 20 / 25 in both eyes, previous medication for glaucoma, past history of optic neuropathy, previous intraocular surgery (such as cataract removal), refractive error greater than -6.00 diopters, and a dysmorphic optic disc. We also excluded patients with an optic nerve head with abnormal findings, such as notching, rim thinning, excavation, presence of hemorrhage, asymmetric cup/disc (C/D) ratios (>0.2 between eyes), large C/D ratio (>0.7), and noncompliance with the ISNT rule. This research study was reviewed and approved by the Institutional Review Board.
Optic disc photography and ImageJ analysis
All patients had instillation of tropicamide-phenylephrine hydrochloride (Mydrin-P; Santen Pharmaceutical, Osaka, Japan) when the study began. Optic disc photographs were then taken using a Kowa nonmyd7 fundus camera (Kowa, Tokyo, Japan) with a Nikon d70s digital camera (Nikon, Tokyo, Japan) after dilatation. All disc photographs were taken by one experienced examiner. Optic disc images were captured using an image capture program that was presented by Kowa. In the settings of the image capture program, the image format was JPEG, and the image resizing quality was set to medium. Optic disc color analysis using ImageJ was done by gray scale calculation of the optic disc. Three different observers calculated the gray scales at three different points for three separate times.
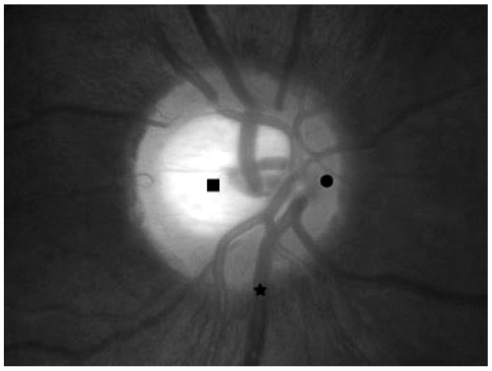
The three points selected by each observer were as follows: 1) nasal rim (NR), the point at three or nine o'clock from the optic disc center; 2) the brightest cupping center (BCC), nearly the center of cupping where the color is brightest; 3) the largest inferior retinal vein (IRV), the point at which the inferior retinal vein comes in contact with the margin (Fig. 1).
To select the site of the optic disc, we applied the Wand tool to the three selected points in the ImageJ program. This Wand tool automatically creates a selection by tracing objects of uniform color or thresholded objects. We used gray scale for the optic disc color analysis with ImageJ. The gray scale was implied to the intensity per pixel area in which it was calculated using brightness values. For color images, the histogram for gray scale was calculated by converting each RGB image into a gray scale value using the formula V = 0.299R + 0.587G + 0.114B. We analyzed the correlation between the gray scale of the three points and the patient's age. The intra-observer and inter-observer correlations were also evaluated to determine the reproducibility of ImageJ.
Statistical analyses
The data were analyzed using the SPSS ver. 15.0 (SPSS Inc., Chicago, IL, USA). The Pearson's correlation coefficient was calculated to evaluate the correlation between gray scales and age. An interclass correlation coefficient (ICC) was used to evaluate intra-observer reproducibility. We calculated the Pearson product-moment correlation to assess the correlation between the measurements. Differences were considered significant when the p-value was less than 0.05.
Results
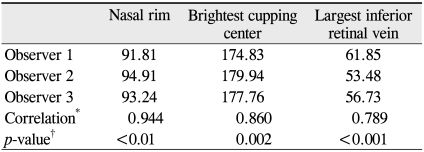
One hundred and twelve eyes of 112 patients (56 male and 56 female) were enrolled in this study. The mean age of participants was 50.6 years old (range, 11 to 82 years). The mean gray scale scores of the NR were 91.81 ± 20.47, 94.91 ± 21.90 and 93.24 ± 20.45; the BCC results were 174.84 ± 31.63, 179.94 ± 31.59 and 177.76 ± 31.56; and the largest IRV calculations were 61.85 ± 14.09, 53.48 ± 12.32 and 56.73 ± 13.62 for observers 1, 2 and 3, respectively. Inter-observer reproducibility for the NR, BCC and largest IRV were relatively high (ICC = 0.944, 0.860 and 0.789, respectively) (Table 1).
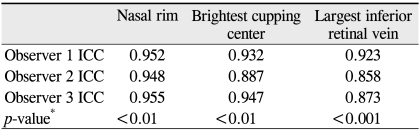
All observers obtained their own high reproducible values for gray scale of NR (ICC = 0.952, 0.948, 0.955 for observer 1, 2, and 3, respectively), BCC (ICC = 0.932, 0.907, 0.947 for observer 1, 2, and 3, respectively) and largest IRV (ICC = 0.923, 0.858, 0.873 for observer 1, 2 and 3, respectively) (Table 2).
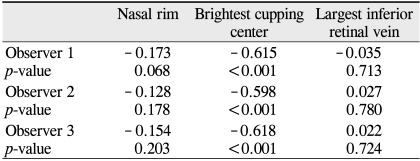
The order of mean gray scale score was the BCC, NR and largest IRV. Significant age-related differences between the values of the brightest cupping center were noted, and the gray scale score was decreased in the older participants (R2 = 0.362). However, the gray scale of the NR and largest IRV did not show age-related differences (R2 = 0.001 and 0.015, respectively) (Table 3 and Fig. 2).
Discussion
A number of previous reports have suggested a variety of methods to analyze the color of the optic disc. A scanning microdensitometric technique was introduced in 1977 that provides an objective means of measuring the degree of optic disc pallor [7]. Fundus reflectometry uses direct measurements of light from an external source that is reflected by the ocular fundus. Miller and Caprioli [4] documented that videographic image analysis using reflectometry provided rapid and quantitative measurements of optic disc pallor. Even though the previous studies objectively evaluated the color of optic discs, these methods required specific measuring instruments such as microdensitometry and reflectometry. ImageJ, however, is a freeware software program and is easy to manipulate.
We excluded patients with a best-corrected visual acuity lower than 20 / 25 from our study because media opacities (including corneal, cataract and vitreous opacity) may influence the results of analyzing the color of the optic nerve head. To minimize the error of acquisition of the photography, we did not change the settings of the capture program or the digital camera during the study.
We used the following three points: the nasal rim, the brightest cupping center and the largest inferior retinal vein. Since the rim remnants are located mainly in the nasal disc sector in very advanced glaucoma, we thought that the color of the nasal rim would be consistent with any changes and may be suitable as an index for the standard color of the optic disc [8]. Narrowing of the retinal vessels was shown in optic neuropathy and glaucoma, and focal retinal arteriole narrowing was observed in eyes with ischemic optic neuropathy or glaucoma [9]. However, the large inferior retinal vein is relatively stable and greater in thickness than the retinal artery, so it is easy to evaluate its color.
Analysis of the color of optic disc indicated that there were significant age-related differences in the gray scales of brightest cupping center (R2 = 0.362). However, there were no correlations between age and the gray scales of the nasal rim and the largest inferior retinal vein (R2 = 0.001 and 0.015, respectively). Significant age-related alterations between connective tissue components were noted in the optic disc. In particular, we observed an age-related increase in elastin and collagen types III and V, and also an age-related decrease in fibronectin [10]. Such findings may be related to the age-related changes in the brightest optic disc cupping center. Varma et al. [11] reported that there were no age-related or refractive error related differences in the disc area or in the neural rim area and cup area; therefore, our findings of no age-related differences in nasal rim color corresponded well with previously reported data.
Inter-observer reliability for analysis of color showed good reproducibility in our study. The highest correlation value of the nasal rim was 0.944, and that of the brightest cupping center was 0.860. The correlation of ICV was lowest (0.789), and this could have resulted from an observational error in point selection that may have been present. A limitation of this study is the pupil size of each patient. The pupil size was important to determine the intensity of the optic disc in fundus photography. If the pupil size was small, the light introduced by the flash decreased, and the color of the optic disc could be changed. To reduce the variation in the amount of light source, all patients had been instilled with mydriatics before the examination. However, we could not exclude accidental errors when analyzing the optic disc completely.
In conclusion, the gray scale of the brightest cupping center was diminished with age in the group with suspected glaucoma. ImageJ offers excellent reproducibility in gray scale calculation for the optic disc. ImageJ can be a useful objective tool to analyze the color of the optic disc and is a highly reproducible program.

 PDF Links
 PubReader
 Full text via DOI
 Full text via PMC
 Download Citation
 Print
Print