Effect of Illumination on Colour Vision Testing with Farnsworth-Munsell 100 Hue Test: Customized Colour Vision Booth versus Room Illumination
Article information
Abstract
Purpose
To evaluate a customized, portable Farnsworth-Munsell 100 (FM 100) hue viewing booth for compliance with colour vision testing standards and to compare it with room illumination in subjects with normal colour vision (trichromats), subjects with acquired colour vision defects (secondary to diabetes mellitus), and subjects with congenital colour vision defects (dichromats).
Methods
Discrete wavelengths of the tube in the customized booth were measured using a spectrometer using the normal incident method and were compared with the spectral distribution of sunlight. Forty-eight subjects were recruited for the study and were divided into 3 groups: Group 1, Normal Trichromats (30 eyes); Group 2, Congenital Colour Vision Defects (16 eyes); and Group 3, Diabetes Mellitus (20 eyes). The FM 100 hue test performance was compared using two illumination conditions, booth illumination and room illumination.
Results
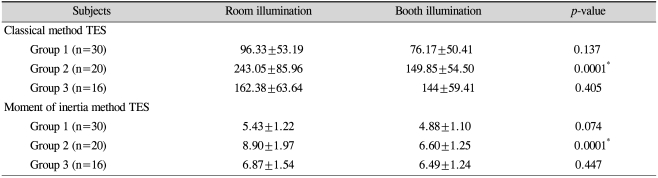
Total error scores of the classical method in Group 2 as mean±SD for room and booth illumination was 243.05±85.96 and 149.85±54.50 respectively (p=0.0001). Group 2 demonstrated lesser correlation (r=0.50, 0.55), lesser reliability (Cronbach's alpha, 0.625, 0.662) and greater variability (Bland & Altman value, 10.5) in total error scores for the classical method and the moment of inertia method between the two illumination conditions when compared to the other two groups.
Conclusions
The customized booth demonstrated illumination meeting CIE standards. The total error scores were overestimated by the classical and moment of inertia methods in all groups for room illumination compared with booth illumination, however overestimation was more significant in the diabetes group.
The Farnsworth-Munsell 100 (FM 100) hue test is a sensitive test for colour discrimination which evaluates both the general performance decrement and specific decrements in the R-G and B-Y axes [1]. The FM 100 hue test should be performed under standard illumination using daylight lamps [2].
In the past, the Macbeth lamp was the prominent commercially available daylight lamp. However, the Macbeth division of the Kollmorgan Corporation discontinued manufacturing of the Macbeth lamp [3]. Current illumination practices are quite varied and the standard viewing booths are expensive. There have been previous attempts to develop a less expensive true daylight illuminator [3]. However, none are commercially available at this time.
The standards for illumination during colour vision testing are given by international standards for colour vision evaluation [4]. Milburn and Mertens [5] validated an inexpensive illuminant for aeromedical colour vision screening by comparing test performance with Macbeth lamp in normal trichromats and persons with varying degrees and types of colour vision deficiencies as diagnosed with Nagel type I anomaloscope.
We constructed a customized, portable FM 100 hue viewing booth in compliance with the standards for colour vision testing [4]. We measured the performance of normal trichromats, subjects with diabetes mellitus-caused colour vision defects, and congenital dichromats in the viewing booth and compared these measurements with those obtained under room illumination.
Materials and Methods
Design of viewing booth
According to colour vision standards, daylight fluorescent lamps should have a colour temperature of 6,500 Kelvin (K), a colour rendering index higher than 90 and a balanced spectral distribution which can be used as an alternative to daylight [6].
Our FM 100 hue viewing booth has a height of 21.85 inches, width of 28 inches, and depth of 20.5 inches. It was constructed from mica and plywood to avoid reflection effects (Fig. 1).

Farnsworth-Munsell 100 hue viewing booth.
The source of illumination was a D65 cool daylight tube (Philips India Ltd., Chennai, India) having a colour temperature of 6,500 K, luminance of 0.80-0.90 cd/cm2, and colour rendering index of 98.
Discrete wavelengths of the source of D65 cool daylight tube were measured using a spectrometer with the normal incident method and were compared with the spectral distribution of sunlight (Table 1) [7].
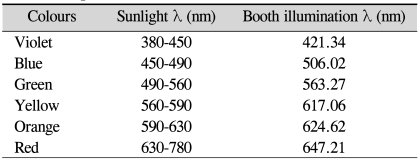
Spectral distribution
Comparison with room illumination
Subjects
During January 2009 to May 2009, 48 subjects were recruited for the study and were divided into 3 groups: Group 1, Normal Trichromats (30 eyes); Group 2, Congenital Colour Vision Defects (16 eyes); and Group 3, Diabetes Mellitus (20 eyes).
Group 1 subjects were identified as normals using Ishihara pseudo isochromatic plates. Group 2 subjects were recruited based on hospital chart reviews. Group 3 subjects with Type II diabetes mellitus were recruited based on history of treatment with oral hypoglycemic medications and insulin.
Inclusion criteria for Group 1 subjects were normal colour vision (using Ishihara pseudo isochromatic plates), best corrected visual acuity of 20/20 for distance and N6 for near, refractive error: myopia & hyperopia <3.00 diopter sphere (DS), astigmatism <1.00 diopters cylinder (DC), no ocular media opacification, systemic abnormalities, congenital or acquired colour vision defects or family history of colour vision defects.
Inclusion criteria for Group 2 and Group 3 subjects were best corrected visual acuity of at least 20/40 for distance and N8 for near, refractive error: myopia & hyperopia <3.00 DS, astigmatism <1.00 DC, Group 2 with congenital colour vision defects (protons & deutans), Group 3 with diabetes mellitus (without diabetic retinopathy and no history of laser photo coagulation).
Exclusion criteria for all 3 groups were history of any ocular surgery or trauma and any corneal or optic nerve pathologies.
Illumination
The FM 100 hue test performance was compared using two illumination conditions, booth illumination and room illumination. Room illumination had one fluorescent tube with colour temperature of 6,300 K, colour rendering index of 79 and illuminance of 350 lux. This is the typical room illumination used in clinics to test colour vision.
Procedure
Informed written consent was obtained from all subjects and the procedure was explained in their vernacular language. The FM 100 hue test was performed monocularly usingroom and booth illumination. Group 2 and Group 3 subjects were tested in both eyes and the eye to be tested first was chosen by tossing a coin. Group 1 subjects were tested only in the right eye. Five to ten minutes of rest was provided between the different illumination tests for the patient's comfort. A time gap of two minutes was given between testing the patient's eyes. Testing conditions were randomized by tossing a coin. Pupil size was measured using Orion non-mydriatic camera. The FM 100 hue total error scores were calculated using web-based scoring software for the FM 100 hue test designed by Torok B.
Statistical analysis
Statistical analyses were performed using statistical software (SPSS ver. 14.0; SPSS Inc., Chicago, IL, USA). The results were expressed as mean±SD if the variables were con tinuous and as percentage if the variables were categorical. Kolmogorov-Smirnov test was used to check for normality. Since all of the parameters were normally distributed, unpaired t-test was used to compare total error scores between room and booth illumination in all 3 groups. Pearson's correlation was used to correlate total error scores between room and booth illumination.
Intraclass correlation coefficient (Cronbach's alpha) was also used to assess the intersession variability. Bland & Altman analysis was performed to evaluate agreement between readings obtained in room and booth illumination. Effect size calculators were also used to estimate the effect of subjects on the testing conditions.
Results
Group 1 (n=30) eyes of normal trichromats, Group 2 (n=20) eyes of diabetes mellitus patients, and group 3 (n=16) eyes of congenital colour vision defect patients were included in the study. Mean ages in Group 1, Group 2, and Group 3 were 24±7, 55±7, and 27±5 years respectively. Mean best corrected visual acuity in Group 1, Group 2, and Group 3 was -0.05±0.07, 0.01±0.06, and -0.01±0.07 (logMAR) respectively.
Table 2 shows the total error scores using the classical method in Group 2 as mean±SD for room and booth illumination were 243.05±85.96 and 149.85±54.50 respectively (p=0.0001). The total error scores using the moment of inertia method in Group 2 as mean±SD for room and booth illumination were 8.90±1.97 and 6.60±1.25 respectively (p=0.0001). Group 1 and Group 3 did not show a statistically significant difference in total error scores between illumination conditions.
Colour vision parameters in different illumination conditions
Table 3 shows that 18 eyes, which were normal in room illumination, appeared to be normal even in booth illumination whereas 12 eyes, which were identified as having diffuse colour discrimination error in room illumination, were identified as normal in booth illumination. Two eyes, which were identified as protanomaly/protanopia, appeared to be normal in booth illumination. One eye which was identified as tritanomaly/tritanopia, appeared to be normal in booth illumination. One eye which was identified as normal appeared to be deuteranomaly/deuteranopy in booth illumination. One eye which was identified as diffuse colour discrimination error in room illumination was identified as tritanomaly/tritanopia in booth illumination. The remainingeyes were identified with the same diagnosis under both illumination conditions.
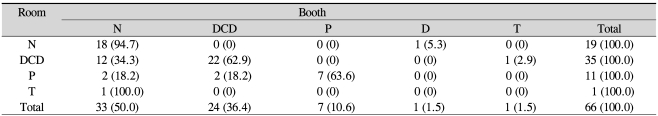
Colour vision abnormalities of study subjects in room and booth illumination
Table 4 shows that Group 2 had lesser correlation (r=0.50, 0.55), lesser reliability (Cronbach's alpha, 0.625, 0.662) and greater variability (Bland & Altman value, 10.5) in total error scores for the classical and moment of inertia methods between the two illumination conditions when compared with the other two groups. Diabetes had a moderate effect (Cohen's d effect size, 0.54, 0.57) on the testing conditions.
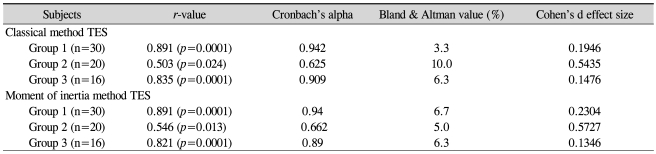
Agreement between room illumination and booth illumination in study groups
Discussion
The present study had two components. In the first, the customized colour vision testing booth wascompared with the illumination standards for colour vision testing. In the second, colour vision testing for two sets of illumination - customized booth versus room light illumination - were tested for normal vision, congenital colour-deficiency and acquired colour deficiency.
The customized booth had illumination meeting CIE standards. The discrete wavelengths were comparable with the spectral distribution of sunlight.
The total error scores were overestimated by the classical and moment of inertia methods in all groups for room illumination compared with booth illumination, however the overestimation was more significant in group 2 with diabetesmellitus. The early treatment diabetic retinopathy study (ETDRS) demonstrated 13 patterns of impaired hue discrimination among diabetics. About 10% of all patients in the ETDRS experienced generalized decrease in hue discrimination compared with pattern A (mean FM 100 score, 241) without any specific pattern of loss (pattern B). Twenty-six percent showed a hue discrimination defect typical of diabetic retinopathy - the so-called yellow-blue defect - increasing with worsening macular edema (patients with pattern C defects) [8].
Colour defects in diabetes vary depending on retinal changes but in congenital defects the colour defect is constant. This may make colour vision changes in diabetics more vulnerable to variance in illumination than in normal vision or congenital colour defect patients. Similarly, group 2 had less correlation, less reliability and greater variability in total error scores with both illumination methods than the other two groups.
Madan et al. (personal communication) found that, at the mesopic level (40 lux), the colour defect was found at blue-yellow axis and, at the photopic level, there was a shift towards the red-green axis. In FM 100 hue test, colorimetric analysis shows that the colour difference (Δc) between the caps is very small, ranging from 0-6 to 5.7 N.B.S. units, with a mean Δc between the caps of about 2-2 N.B.S. units. Changes in illumination can affect the total error scores [4].
This study shows the difference in hue discrimination in diabetes with changing illumination. It would be interesting to study these changes with varying degrees of retinopathy. The limitation of our study is the small sample sizes in each group. However, to the best of our knowledge, it is the first study to evaluate the effect of different illumination on colour vision testing in subjects with normal colour vision, congenital colour defects and acquired colour deficiencies.
Notes
No potential conflict of interest relevant to this article was reported.