Because retinal nerve fiber layer (RNFL) defect is reported to be a good indicator of optic nerve damage in glaucoma patients,1-5 many researchers have attempted to develop a grading system for RNFL photography.6-8 Previous grading systems, however, did not allow for easy interpretation of RNFL photographs. These systems required both a photographic reference set and extensive experience to become skillful in grading.
We obtained high-quality RNFL photographs using the Heidelberg Retina Angiograph 1 (HRA1; Heidelberg Engineering, Dossenheim, Germany). HRA1 is a modern confocal laser scanning system for retinal angiography, which can make digital, high resolution, red-free (blue-reflectance; 820 nm) fundus reflectance images. We previously reported the capability of the RNFL photography using HRA1 to differentiate between healthy eyes and eyes with early stage glaucomatous visual field loss.9 The purpose of this study was to evaluate the usefulness of a new scoring system for RNFL photography using HRA1. The diagnostic value of this scoring system was studied by comparing the visual field indices of standard automated perimetry (SAP).
Materials and Methods
Subjects
This retrospective study included 964 eyes from 500 subjects including 128 healthy normal eyes and 836 eyes with primary open angle glaucoma had various stages of visual field defects (572 early, 164 moderate and 100 severe). Both eyes of each patient were included in the study if they satisfied the entry criteria as follows: each eye had a best corrected visual acuity of 20/25 or better, a spherical equivalent refractive error between -5 and +5 diopters, clear ocular media with no clinically significant cataract, a normal open angle, and no previous intraocular surgical history.
The diagnosis of glaucoma was based on the presence of typical glaucomatous optic disc damage, as judged by stereoscopic examination by a glaucoma specialist (Y. J. Hong), and the presence of glaucomatous visual field loss as measured by SAP. The patients had no significant ocular diseases other than glaucoma and no other diseases affecting visual fields. The normal controls had no visual field changes on SAP, intraocular pressure below 21 mmHg, no optic nerve head or retinal nerve fiber layer changes suggestive of glaucoma, no other ocular disease or surgical history, no diabetes, and no family history of glaucoma.
Measurements
All subjects were examined using SAP (Carl Zeiss Meditec Inc, Dublin, CA) with a 30-2 Swedish interactive threshold algorithm (SITA) standard strategy. The minimal visual field abnormality was determined by SAP and was defined as significant when: (1) the Glaucoma Heimifield Test was "outside normal limits" in 2 consecutive fields; (2) 3 or more adjacent points were present in an expected location of the central 24-degree field that depressed below the 5% level on the pattern deviation plot (PDP), one of which must have been below the 1% level in 2 consecutive fields; or (3) pattern standard deviation (PSD) was significant below the 5% level in 2 consecutive tests.10 Visual field defects were divided into 3 stages: early, moderate, and severe.11 The early stage of a glaucomatous visual field defect was defined as having: (1) a mean deviation (MD) of no worse than -6dB, (2) fewer than 25% of the points depressed below the 5% level and fewer than 15% of points depressed below the 1% level on PDP, and (3) no point within the central 5-degree field with a sensitivity of less than 15dB. A moderate stage of visual field defect was defined as having: (1) MD of worse than -6 dB but no worse than -12dB, (2) fewer than 50% of the points depressed below the 5% level and fewer than 25% of points depressed below the 1% level on PDP, (3) no point within the central 5-degree field with a sensitivity of less than or equal to 0 dB, and (4) only 1 hemifield containing a point with sensitivity less than 15dB within 5 degrees of fixation. Criteria for severe defects in glaucoma were defined as: (1) MD worse than -12 dB, (2) more than 50% of the points depressed below the 5% level and more than 25% of points depressed below the 1% level on PDP, (3) any point within the central 5-degree field with a sensitivity of less than or equal to 0 dB, and (4) both hemifields containing a point(s) with sensitivity less than 15 dB within 5 degrees of fixation.
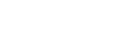
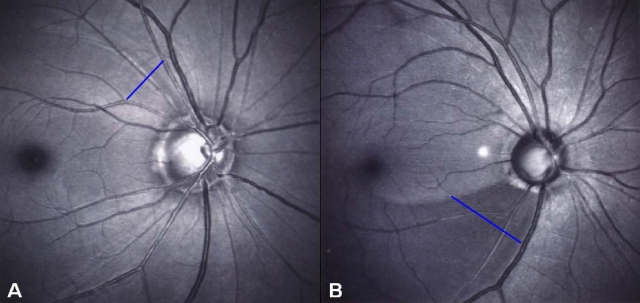
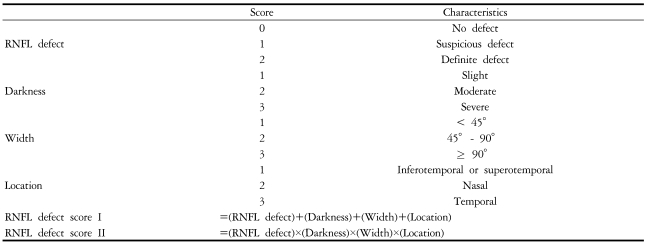
The RNFL photographs were recorded with blue reflectance ("red-free") images using the HRA1. Two of authors (S. Hong & S. J. Ha) interpreted the RNFL photos using the two scoring systems (Table 1) under the masking of the diagnosis. For darkness scores, the contrast and brightness of RNFL photos were adjusted to distinguish sharply the retinal blood vessels from the background using Heidelberg Eye Explorer program (Heidelberg Engineering, Dossenheim, Germany). On location scores were shown in Fig . 1. A reference plane was set across the horizontal raphe dividing the papillomacular bundle into two vertical halves. RNFL in the 15 degrees above and below this reference plane was termed the 'Temporal' sector. RNFL in the 75 degrees from the end of the 'Temporal' sector to the vertical line dividing the optic nerve head into two halves was termed as 'Supero-, and Infero- temporal' sectors for the respective vertical positions. The remaining 180 degrees of nasal RNFL was designated as the 'Nasal' sector. In cases with a large or multiple RNFL defect over several sectors, the highest location score was applied.
If the two scores did not agree with each other, the other two glaucoma specialists (Y. J. Hong & G. J. Seong) were asked to interpret it. Table 1 showed the scoring methods to assess the RNFL photo.9 The RNFL defect score I was a summation of each score, and the RNFL defect score II was the product of each score - RNFL defect, darkness, width, and location. The RNFL defect score I could range from 0 to 11, and the RNFL defect score II could range from 0 to 54. The interval between the SAP and RNFL photography was less than 1 month.
Data Analysis
To assess correlations between RNFL photographs using HRA1 and SAP, we compared two RNFL defect scores (RNFL defect score I and II) and visual field indices (MD and PSD) of SAP. Statistical comparisons between groups were conducted using an independent 2-tailed Student t-test, and P-values less than 0.05 were considered statistically significant. Statistical analysis for linear regression was performed using the MedCalc for Windows program, version 7.6.0.0 (MedCalc Software, Mariakerke, Belgium). Statistical analyses other than linear regression were carried out using the program SPSS for Windows, version 11.5 (SPSS Inc, Chicago, IL).
Results
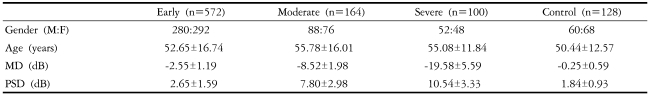
Nine hundred sixty-four eyes from 500 subjects including 128 healthy normal eyes and 836 eyes with primary open angle glaucoma were evaluated. In the glaucoma group, 572 eyes showed early visual field defects on SAP, 164 showed moderate defects, and 100 showed severe defects. All control subjects had normal visual fields on SAP. Demographic data and visual field indices for SAP of subjects are shown in Table 2, and the scoring systems for RNFL photographs using HRA1 are shown in Table 3.
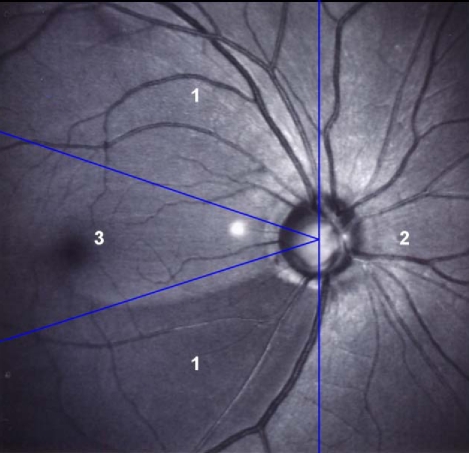
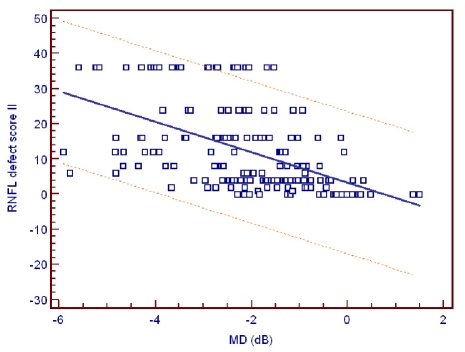
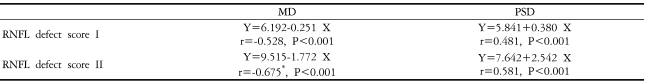
Table 4 and Fig. 2, 3 show the correlation between RNFL defect scores and visual field indices of SAP. Correlations between the RNFL defect score II and MD of SAP were the strongest (Y = 9.515-1.772 X, r = -0.675, P<0.001) (Fig. 2b). Correlations between the RNFL defect score I and PSD of SAP were the worst (Y=5.841+0.380 X, r=0.481, P<0.001) (Fig. 3a) even though it had statistically significant correlation.
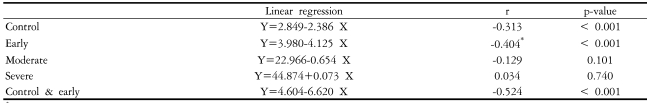
Since the RNFL defect score II and MD of SAP showed the strongest correlation, correlations between these variables for various stages of visual field defect on SAP were evaluated, as shown in Table 5. The R value of early, moderate, severe, and control groups was -0.404, -0.129, 0.034 and -0.313, respectively. The strongest correlation between RNFL defect score II and MD of SAP was in the early stage visual field loss group (Y=3.980-4.125 X, P<0.001).
The second strongest correlation was in the control group (Y=2.849-2.386 X, P<0.001). Additionally, linear regression analysis for RNFL defect score II and MD of SAP in early glaucoma and control groups showed good correlation (Y=4.604-6.620 X, r=-0.524, P<0.001) (Fig. 4).
Discussion
Though RNFL photography is an important part of the examination of glaucoma patients, it is a subjective and qualitative method. Thus, an objective and quantitative method for assessing RNFL photos is very desirable. Some researchers have tried to develop a grading system for RNFL photography,6-8 but interpretation of RNFL photos has remained very difficult.
In the present study, we recorded RNFL photographs with blue reflectance ("red-free") images using HRA1. RNFL loss was assessed using a new scoring system (Table 1).9 On location scores, score "1" represents inferotemporal or superotemporal area, "2" represents nasal area, and "3" represents temporal area (Fig. 1). Since the inferotemporal and superotemporal sectors are the early affected sectors and nasal sector is the late affected sector in glaucoma,12-15 we gave additional points to the nasal area. The RNFL defect score I was a summation of each score, and the RNFL defect score II was the product of each score - RNFL defect, darkness, width, and location. The RNFL defect score I could range from 0 to 11, and the RNFL defect score II could range from 0 to 54. Two examples of the interpretation of RNFL photography using HRA1 is shown in Fig. 5.
The two new RNFL defect scoring systems strongly correlated with visual field indices of SAP. Among various combinations, the RNFL defect score II and the MD of SAP showed the strongest correlation (r = -0.675, P<0.001) (Fig. 2b). Additionally, these measurements correlated more strongly in the group with normal and early visual field loss compared to the moderate and severe visual field loss groups (r=-0.313, P<0.001) (Fig. 4). This suggests that RNFL photography may be more meaningful in early stage glaucoma patients, and RNFL defect score II can be used to interpret RNFL photography using HRA1 for early glaucoma patients.
In this study, we included the glaucoma patients who had a typical glaucomatous optic disc damage and a glaucomatous visual field defect. Additionally, the normal control participants had no optic nerve head or retinal nerve fiber layer changes and no visual field defect. These inclusion criteria may be biased particularly in the early glaucoma patients.
In conclusion, we have presented a method for the semi-quantitative interpretation of RNFL photos through the use of a new scoring system for RNFL photography. This method provides good reliability and may extend the evaluation RNFL photography to non-specialists.


 PDF Links
 PubReader
 Full text via DOI
 Full text via PMC
 Download Citation
 Print
Print