


The prevalence of myopia worldwide has increased to an estimated 15% to 30% and is especially high in young people in East Asian countries [1-5]. School myopia seems to be multifactorial and influenced mostly by environmental factors, although heredity can also affect the development and deterioration of myopia [4]. Less time spent outdoors and more time spent indoors studying seem to be related to a high prevalence of school myopia [6-9]. Myopia is a critical health concern because uncorrected myopia can lead to visual disturbance [10]. With regard to the ocular morbidity of myopia, high myopia can increase the risk of vision-threatening pathologies associated with alterations in the retina and choroid [4,11].
Obesity, characterized by elevated adiposity, is also a leading healthcare issue. A low physical activity level and high caloric intake are risk factors of obesity [12]. Obesity is a critical factor increasing both cardiovascular disorders and diabetes and is associated with diminished life expectancy [13].
East Asian countries have undergone rapid socioeconomic development and urbanization in recent decades [14]. The prevalence of myopia in East Asia, which is characterized by high-intensity education, has rapidly increased over the past 30 to 40 years. Recently, approximately 70% to 90% of young people, especially with a high level of education, have been found to be myopic in these countries [4,15-18]. In addition, lifestyle changes such as a sedentary lifestyle and a Westernized diet have contributed to an escalating prevalence of overweight and obesity in East Asia [14,19,20]. Changing environmental elements such as less time spent outdoors and reduced physical activity could lead to the increasing prevalence of both myopia and obesity [7-9,12].
Subjects with myopia (near-sightedness) can have difficulty with far vision without being correction via glasses, contact lenses, or surgery. Wearing spectacles may limit participation in some sports or vigorous physical activities [21]. Thus, there is the possibility that myopia could affect lifestyle. However, there has been little concern on systemic comorbidities associated with lifestyle change in adults with myopia.
The relationship between myopia and obesity has been found in several studies using body mass index (BMI) [22-24]. The association between myopia and BMI has caused some controversy. Some studies have demonstrated that obese individuals tend to be myopic [25,26], but others have suggested the opposite result [22-24,27]. BMI has been widely applied as a screening method for obesity [28,29]. Even though BMI is a simple and noninvasive strategy for evaluating body fatness, it cannot measure true adiposity because a differentiation between body fat and fat-free tissue is not possible. Direct quantitative measurement of fat tissue would more accurately reflect fatness [30]. Few research have reported an association between myopia and fat content [27,31]. To the best of our knowledge, there has been no study reporting the relationship between myopia and fat content in adults of diverse ages.
In this study, we investigated the relationship between myopia and obesity through direct measurements of fat content obtained in a nationwide, population-based study, the Korea National Health and Nutrition Examination Survey (KNHANES), which can represent a whole population in South Korea.
Materials and Methods
Ethics statement
The KNHANES is an ongoing nationwide epidemiological study conducted by the Division of Chronic Disease Control and Prevention, Korean Ministry of Health and Welfare, with the approval of its Institutional Review Board. The survey follows the tenets of the Declaration of Helsinki for biomedical research involving humans. Written informed consent is provided by all participants. The Institutional Review Board/Ethics Committee approvals for the study were obtained from the Korea Disease Control and Prevention Agency.
Study design and setting
The KNHANES has been performed annually since 1998, using a stratified, multistage, probability cluster survey with a rolling survey model. All of the participants are randomly selected from randomly assigned districts of cities and provinces in South Korea. It consists of three parts: health interview, health examination, and nutrition surveys. The health examination provides data on ophthalmologic examinations, anthropometric measurements, and health interview includes sociodemographic factors.
Among participants in the KNHANES 2008-2010, those who were 19 years or older were included. The criteria for exclusion were cataract or pseudophakic or aphakic eyes, pterygium, and a history of refractive surgery. Cataract was defined as lens opacities (Lens Opacities Classification System [LOCS] III score, ≥2) including nuclear, cortical, posterior subcapsular, anterior capsular, or combined type compared with standard photographs, similar to previous studies [32,33].
Data on anthropometrics and demographic characteristics, including socioeconomic status, education level, and physical activity, were collected. Participants were divided into nondrinkers, light-to-moderate drinkers (1-30 g alcohol/ day), and heavy drinkers (>30 g alcohol/day). Smoking status was categorized as nonsmoker or ever-smoker (ex-smoker or current smoker). Physical activity scores were categorized based on the International Physical Activity Questionnaire guidelines. Moderate physical activity was defined as the performance of moderate-intensity physical activity for more than 20 minutes three or four times per week. Moderate intensity was defined as exercise that induced a mild increase in breathing or heart rate for at least 10 minutes. Subjects were assigned to the low-income group when their income is corresponded to the lowest quartile. The education level of participants was categorized into four groups: elementary school or lower, middle school graduate, high school graduate, and university graduate or higher.
Measurements
Participants underwent ophthalmological examinations, including slit-lamp examinations and fundus photography. Ophthalmologists measured intraocular pressure using a Goldmann applanation tonometer (Haag-Streit Inc). Refractive error was obtained using a Topcon KR8800 autorefractor (Topcon Corp). Spherical equivalent (SE) was calculated as “spherical error + 1/2 cylinder.” Intraocular factors were analyzed as categorical variables and continuous variables. Participants were divided into three groups according to refractive status: myopia (SE ≤ −1.0 diopter [D]), emmetropia (−1.0 D < SE ≤ 1.0 D), and hyperopia (SE > 1.0 D).
Anthropometric evaluation was performed by trained measurer. Height was measured to the nearest 0.1 cm with the use of stadiometer (SECA 225, SECA Deutschland). Body weight was measured to the nearest 0.1 kg on a balanced scale (GL-6000, CAS KOREA). Waist circumference (WC) was measured in a horizontal plane at the level of the umbilical region at the end of normal expiration. BMI was calculated as “body weight / height2 (kg/m2).” BMI was categorized as obese (BMI, ≥25 kg/m2), overweight (BMI, 23-24.9 kg/m2), normal weight (BMI, 18.5-22.9 kg/m2), and underweight (BMI, <18.5 kg/m2) [13,34]. Fat mass was measured with whole-body dual energy x-ray absorptiometry (DEXA; QDR 4500 A, Hologic Inc). Body fat percentage was calculated as “total fat mass / body weight × 100.”
Statistical analysis
SAS ver. 9.2 (SAS Institute Inc) was used for statistical analyses to reflect sampling weights and to offer nationally representative prevalence estimates. Continuous and categorical parameters were described as the mean ± standard error and percentage, respectively. BMIs were divided into underweight (<18.5 kg/m2), normal weight (18.5-22.9 kg/ m2), overweight (23.0-24.9 kg/m2), and obese (≥25 kg/m2) using the Asia-Pacific cutoff points. Participants were categorized by quartile of fat percentage. Abdominal obesity was defined by the standards for metabolic syndrome (cutoff for WC, ≥90 cm for men and ≥80 cm for women), modified for the Asian population [35,36]. Persons were analyzed separately according to three age groups (young, 19-39 years; middle age, 40-64 years; old age, ≥65 years). For obesity subgroup analysis, four groups were defined as follows: nonobese, only abdominal obesity without general obesity, only general obesity without abdominal obesity, and combined abdominal and general obesity. Differences in obesity parameters according to refractive error were determined via analysis of covariance (ANCOVA), adjusting for covariates. Multivariate adjusted logistic analysis was performed to evaluate the connections between myopia and obesity-associated variables. Factors that showed a difference with p < 0.25 between the two groups were entered into a multivariate analysis. Odds ratios (ORs) and 95% confidence intervals (CIs) were calculated. A p-value of <0.05 was considered to express statistical significance.
Results
Among the 29,235 participants in the KNHANES 2008-2010, those who were 19 years or older were included in the present study (n = 21,811). Among them, a total of 16,548 underwent evaluations for fat mass. Individuals with cataract or pseudophakic or aphakic eyes (n = 4,569), pterygium (n = 1,151), a history of refractive surgery (n = 263), or incomplete medical data (n = 260) were excluded. Ultimately, a total of 10,305 subjects were included in this study.
The demographics are shown in Table 1 according to refractive status (myopia, emmetropia, hyperopia). Subjects with myopia were younger and tended to be male than those with emmetropia (p < 0.001) or hyperopia (p = 0.005). The mean refractive error, calculated as SE, was −3.47 ± 0.04, −0.23 ± 0.01, and 1.66 ± 0.04 D in participants with myopic, emmetropic, and hyperopic eyes, respectively. Individuals with myopia tended to have a higher education level (p < 0.001), a higher income (p < 0.001), residence in an urban area (p < 0.001), less physical activity (p = 0.002), and a lower vitamin D level (p < 0.001) compared to those without myopia. The differences between the groups according to refractive status were also significant for current smokers and heavy alcohol drinkers (all p < 0.001). Height and weight significantly differed by refractive error (all p < 0.001).
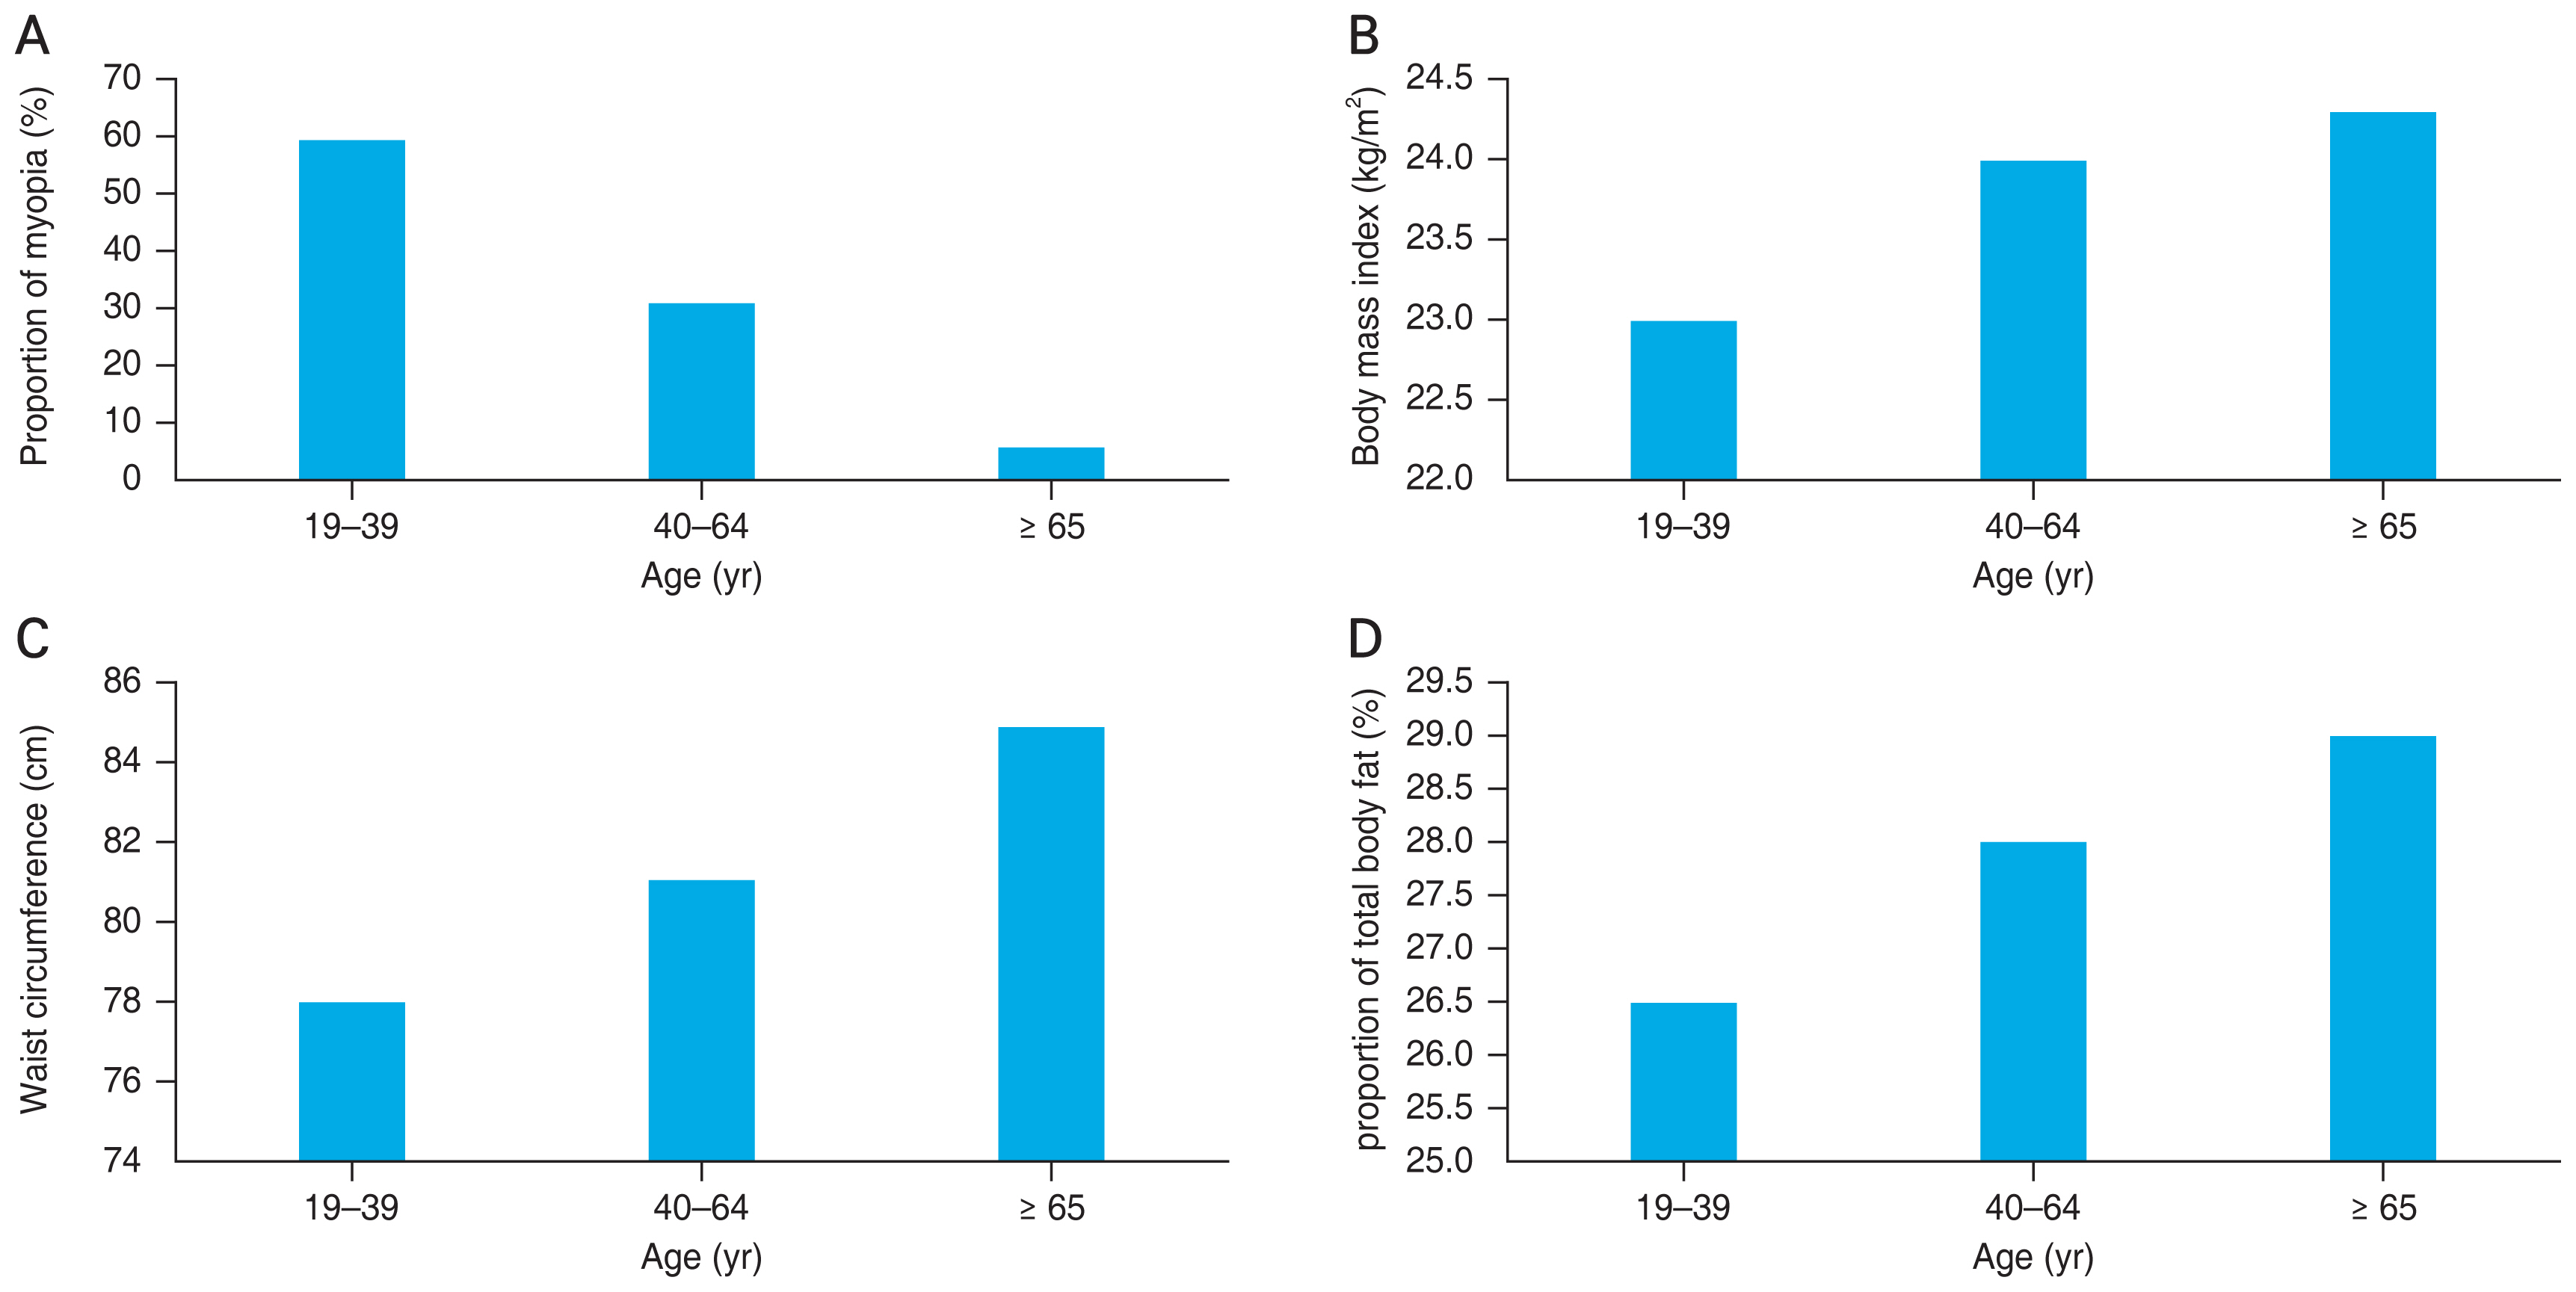
The proportion of myopia decreased with age ( p for trend, <0.001) whereas BMI, WC, and the proportion of total body fat increased with age (both p for trend, <0.001) (Fig. 1A-1D).
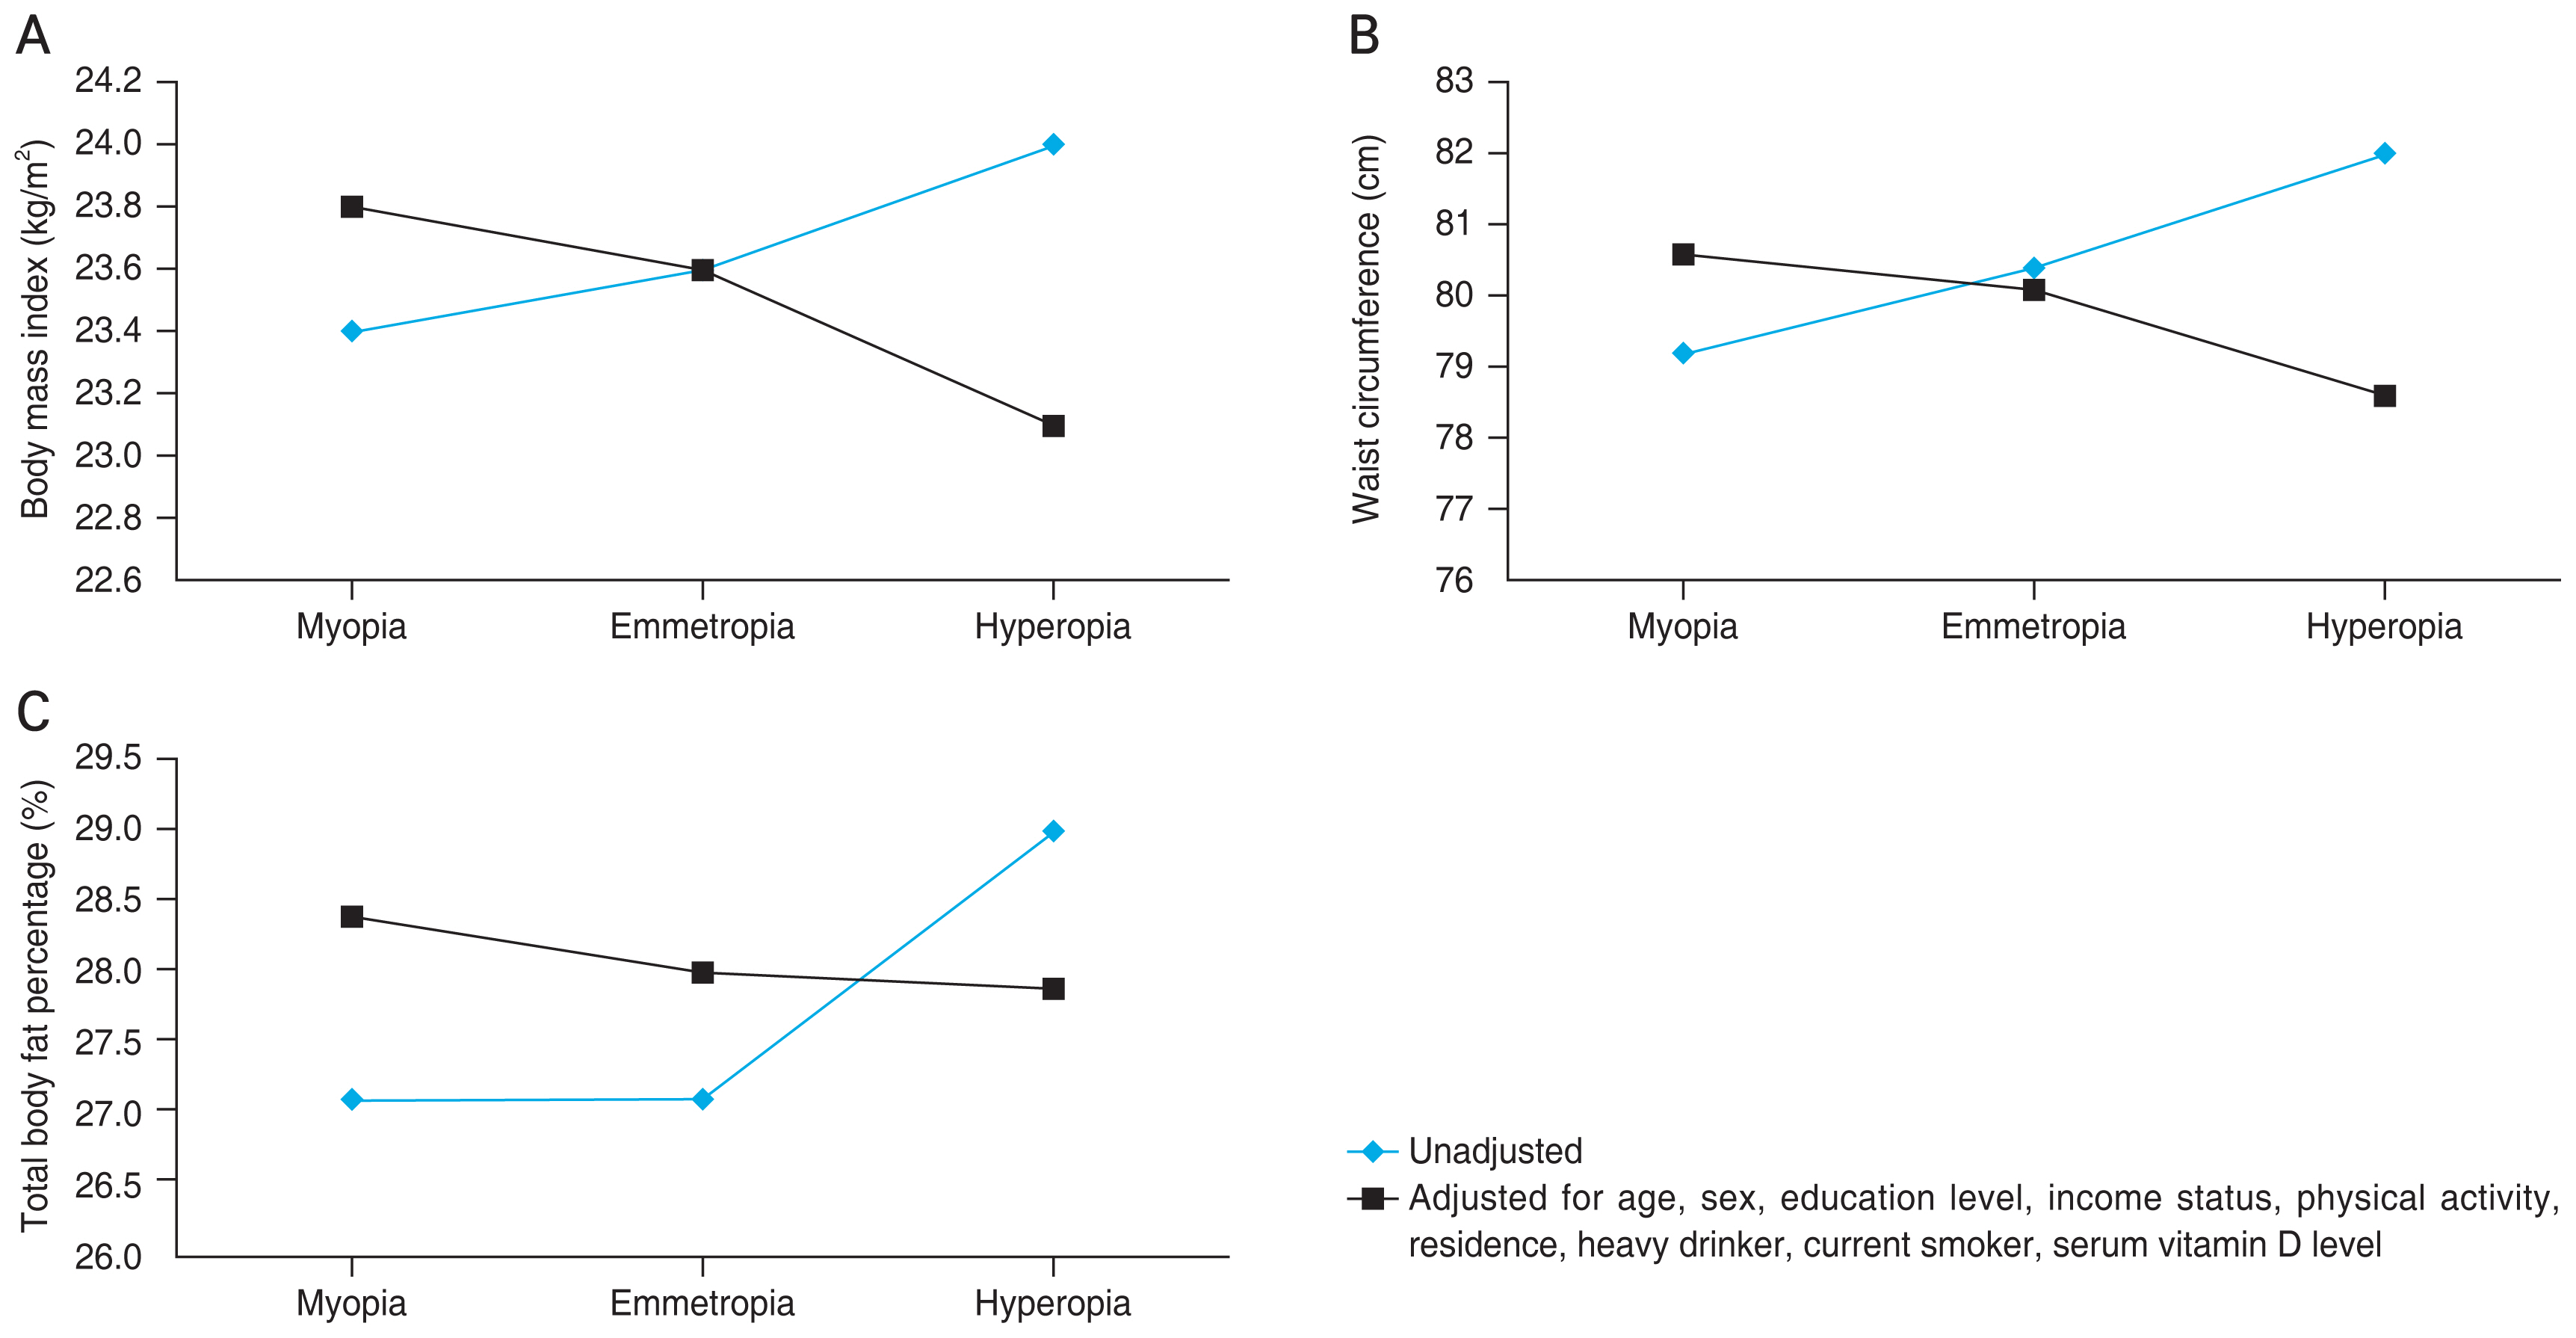
Table 2 shows the distribution of obesity parameters according to refractive error in the total population and age groups. In the total population, BMI, WC, and total body fat percentages were greatest in persons with hyperopia in the unadjusted model (model 1). After adjustment for age and sex (model 2), the trend of BMI and total body fat percentage with regard to refractive error was reversed (Fig. 2A-2C). Higher levels of obesity parameters in participants with myopic eyes remained significant after adjustment for age, sex, education level, income status, physical activity, residence, and serum vitamin D level (model 3).
In different age groups, the relationships between refractive error and obesity-related variables were similar to those in the total population after adjustment of covariates (Table 2 and Fig. 3A-3C). The differences in BMI according to refractive error were statistically significant in the middle age group (40-64 years, p = 0.020). The significant difference in total body fat percentage among myopia, emmetropia, and hyperopia was significant in the young age group (19-39 years, p = 0.005) and marginally significant in the middle age group (40-64 years, p = 0.067) but not in the old age group (≥65 years, p = 0.345). The significant difference in WC among myopia, emmetropia, and hyperopia was significant in the young age group (19-39 years, p = 0.003), and the middle age group (40-64 years, p = 0.022).
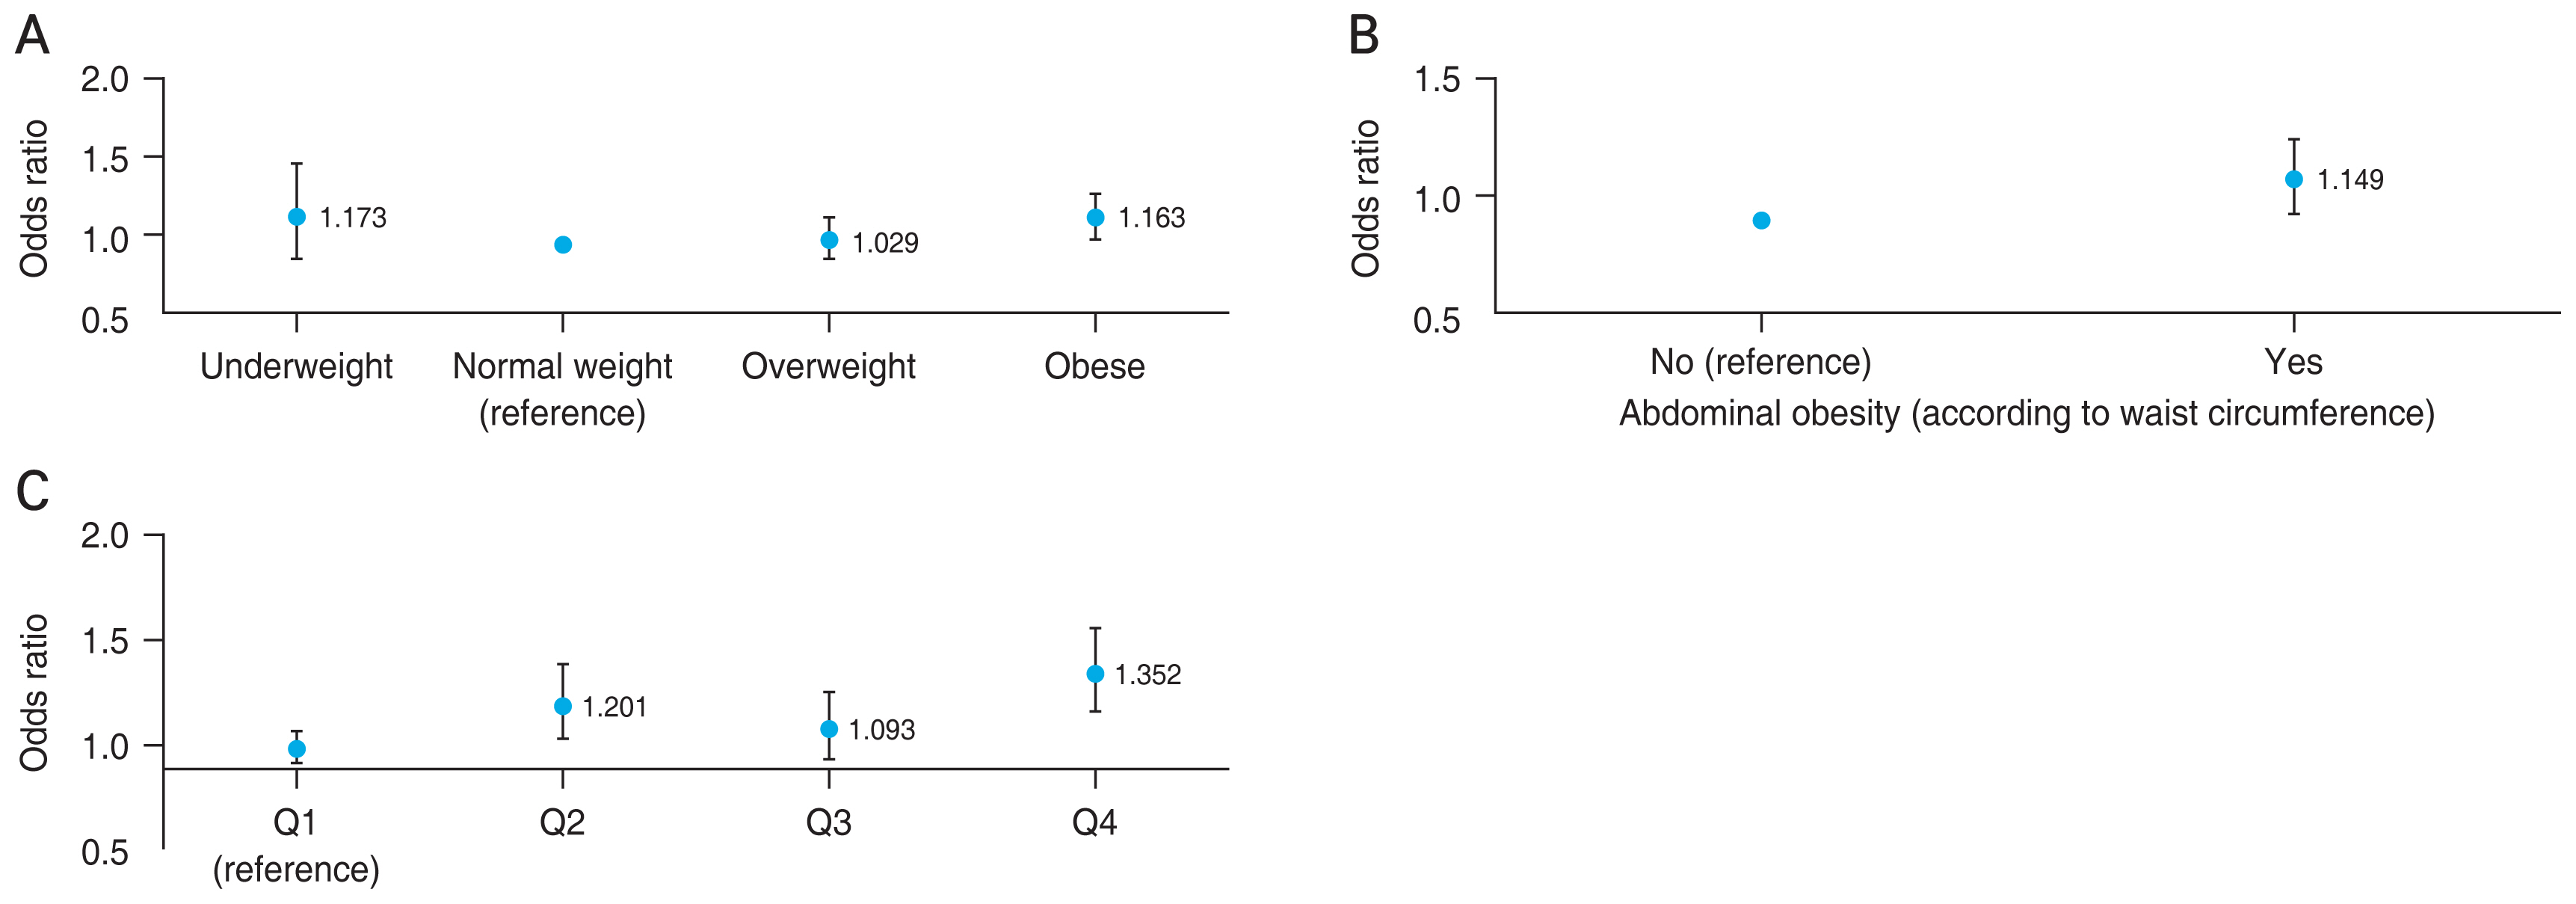
The ORs for obesity variables regarding myopia after adjustment for covariates are depicted in Fig. 4A-4C. Obese subjects (BMI, ≥25 kg/m2) had a higher probability of having myopia compared to individuals with a normal weight (multivariate OR, 1.163; 95% CI, 1.035-1.308). Abdominal obesity was associated with myopia (multivariate OR, 1.149; 95% CI, 1.026-1.286). Those with a higher percentage of total body fat had greater ORs for myopia (fourth quartile of body fat; OR, 1.352; 95% CI, 1.178-1.551).
In the subgroup analysis for general and abdominal obesity, individuals with both abdominal and general obesity had higher ORs for myopia than those without any type of obesity (OR, 1.188; 95% CI, 1.042-1.356) (Fig. 5).
Discussion
We demonstrated that obesity-related parameters were associated with myopia in adults using nationally representative data. Total body fat percentage and BMI or WC tended to be higher in subjects with myopia. In different age groups, the differences in fat percentage according to refractive error were significant in individuals younger than 40 years but not in those 40 years or older.
For evaluation of obesity, BMI or WC remain the most commonly employed methods [28,29]. Prior research studies with regard to the association between myopia and BMI have not been consistent. Some demonstrated that obesity was related to myopia [25,26,37]. Gardiner [25] found that weight gain was rapid in children with myopia. Others suggested the opposite result [22-24]; in those studies, subjects with cataracts were not excluded. The prevalence of myopia was 17.0% in one study which performed in rural India [24], whereas the proportion of myopia in this study was about 39.8%. The discrepancy between studies might be attributable to whether cataracts were excluded or different prevalence of myopia between countries.
Anthropometric measurements such as BMI or WC cannot correspond precisely with the degree of obesity because they involve fat-free mass as well as fat mass. In Asia, where most studies with regard to myopia and obesity have been performed, an equal or even higher prevalence of diabetes than the West was reported in spite of a relatively lower BMI [38]. Asians tend to have more abdominal or visceral fat than Europeans with the same BMI [39]. Therefore, BMI seems to have limitations for the measurement of body fat, especially in Asians.
Using DEXA, total body fat percentage was higher in subjects with myopia in this study. Previously, one study found that fat content was lower among myopic than non-myopic individuals, in contrast to our results. However, only men aged 31 to 36 years old were included, without adjustment for the characteristics of the study subjects [27]. There has been no study investigating the connection between myopia and fat content in adults of different age groups.
There are a few speculations for the association between myopia and obesity. First, nutrition, an environmental factor, could be related to myopia. Lim et al. [40] reported that higher saturated fat and cholesterol ingestion was related to myopia in children. Childhood obesity often results in adulthood obesity, as 30% to 50% of obese children remain obese as adults [41,42]. There is a possibility that the development and deterioration of myopia in adolescents could be related to obesity in adults, even though we did not investigate this relationship in childhood. Second, Myopia mostly results from axial elongation, although corneal radius and lens thickness influence it as well [4]. Several studies have reported that fibroblast growth factors (FGFs) are related to myopia [31,43,44]. FGFs are one of the signals that control the evolution of mesodermal tissues such as fat [45]. Adipose tissue, such as muscle and bone, is commonly considered to have a mesodermal origin [46]. It is probable that myopia has a connection with adiposity, even though it is just a speculation. Third, obesity and myopia could be connected through a lack of physical activity, which often takes place outdoors. Reduced time spent in outdoor activities was found to be associated with myopia [7-9]. Subjects who wear spectacles for myopia are less likely to take part in sports or vigorous physical activities [21]. Decreased physical activity could contribute to the development of obesity [47]. This hypothesis would have been clearer if we had analyzed whether the correlation between myopia and obesity depends on outdoor activity. However, in the KNHANES 2008-2010, outdoor activity was not measured. Further study adjusting outdoor activity is required to clarify the relationship between myopia and obesity.
The prevalence of myopia is high in younger people, whereas obesity-related parameters are higher in older people [13,48], corresponding to our results (Fig. 1). The relationship between myopia and adiposity is likely complex. Therefore, we stratified our analysis of this association by age. The relationship between myopia and total fat proportion was significant for young-aged subjects, but not for old subjects. In those ≥65 years, the proportion of myopia was 5.7%. The small number of myopic older subjects might have led to the absence of a correlation between myopia and obesity.
One of the limitations of this study is that myopia was measured only by noncycloplegic refractive error. A strength of this study is that the evaluation of obesity included direct assessment of adiposity using DEXA as well as indirect evaluation using BMI or WC. In addition, the analysis was based on nationally representative data in adults. We adjusted for the factors potentially associated with myopia or obesity, such as income status, education level, and serum vitamin D level. Tendency of lens being more hyperopic with aging could be another limitation [49]. We have excluded participants whose LOCS III score being 2 or more than 2, so we expect there to be minor differences. Exclusion of individuals with cataract or pseudophakic or aphakic eyes, pterygium, a history of refractive surgery could cause selection bias. However, the exclusion was necessary to evaluate the relationship between myopia and obesity because those ocular diseases or history of ocular surgeries could affect the refractive error.
In conclusion, obesity measured with direct assessment of fat mass was related to myopia in adults, especially among relatively young individuals. The development of myopia generally ends in adolescence, but obesity typically increases with age [50]. In adults with myopia, an increased awareness of the risk of obesity may be helpful in promoting the population’s health and wellbeing.


 PDF Links
 PubReader
 ePub Link
 Full text via DOI
 Full text via PMC
 Download Citation
 Print
Print