Peripapillary Perfusion Analysis Using Optical Coherence Tomography Angiography in Patients with Normal Tension Glaucoma
Article information
Abstract
Purpose
This study aimed to assess the difference in the vascular parameters of perfusion in the optic nerve head in normal tension glaucoma (NTG) across disease stages using optical coherence tomography angiography and its correlation with peripapillary retinal nerve fiber layer (RNFL) thickness.
Methods
In this retrospective study, 83 eyes with varying stages of NTG (25 mild, 31 moderate, and 27 severe) and 90 healthy eyes were enrolled. The perfusion density (PD) and flux index (FI) of the optic nerve head divided into four sectors were determined. We compared the vascular, structural, and functional parameters between normal and glaucomatous eyes and performed a subgroup analysis among the NTG stages. Pearson correlation coefficient was used to assess the topographic correlation between vascular parameters and RNFL thickness.
Results
PD and FI were significantly decreased in the NTG group. Subgroup analysis revealed a significant decrease in vascular parameters in most regions in the NTG group, except for the nasal PD and temporal FI. Post hoc analysis showed a significant decrease in PD in the inferior region across all severity levels (mild vs. moderate, p = 0.012; moderate vs. severe, p = 0.012; mild vs. severe, p < 0.001). PD and FI were strongly correlated with RNFL thickness in all quadrants (all p < 0.001), with the strongest correlation observed in the inferior region.
Conclusions
Vascular parameters were significantly decreased in glaucomatous eyes, and the degree of decrease in vascular parameters was proportional to glaucoma severity. Peripapillary perfusion analysis using optical coherence tomography angiography may complement other measurements used for glaucoma diagnosis.
Glaucoma is defined as a progressive optic neuropathy characterized by the loss of retinal ganglion cells, leading to the loss of the retinal nerve fiber layer (RNFL) [1]. Structural loss, including the RNFL and/or ganglion cell layer with inner plexiform layer (GCIPL), can precede detectable functional loss by up to 5 years [2]. Detection of structural changes and/or corresponding visual field loss is crucial for the diagnosis and detection of glaucoma progression [1,2]. Although optical coherence tomography (OCT) is extensively used in clinical practice to measure peripapillary RNFL thickness, its ability to identify a very early stage of the disease or to detect its progression to advanced stages can be limited [3]. OCT angiography (OCTA) has recently emerged as a complementary tool to OCT for the diagnosis of glaucoma, offering qualitative and quantitative measurements of vascular perfusion in the retina and optic nerve head (ONH) at high resolution [3–5].
Several studies have reported that vascular dysfunction and impaired ocular blood flow play important roles in the development and progression of glaucoma [6–9]. Impaired ocular blood flow and vascular autoregulation result in episodes of transient ischemia and reperfusion injury that cause thinning of the RNFL and ganglion cell layer thinning [1,10,11]. Vascular dysfunction and ischemia have been recognized as a significant contributing factor especially in the pathogenesis of normal tension glaucoma (NTG) [12].
OCTA is a noninvasive, dye-free modality that allows qualitative and quantitative assessment of the vasculature of the retina and ONH. OCTA measurements have been used to visualize the microcirculation status of the retina and peripapillary regions with reasonable repeatability and reproducibility [13]. Previous studies using OCTA in eyes with early primary open-angle glaucoma (POAG) and NTG showed reduced vascular parameters within the ONH and peripapillary region compared to normal controls [14]. Furthermore, changes in vascular parameters were found to be significantly correlated with clinical markers of glaucoma, including RNFL thickness and visual field indices, and were reported to be positively correlated with the severity of glaucoma [11,15].
In this study, we assessed the vascular parameters of peripapillary perfusion in Korean patients with NTG across varying stages using OCTA and compared them with those of normal control eyes. We also investigated the correlation between peripapillary RNFL thickness and glaucoma severity.
Materials and Methods
Ethics statement
The study was approved by the Institutional Review Board of Siloam Eye Hospital. (No. 2023-06). The study adhered to the tenets of the Declaration of Helsinki and complied with the Health Insurance Portability and Accountability Act. The requirement for informed consent was waived due to the retrospective nature of the study.
Study design
This retrospective cross-sectional study was conducted at Siloam Eye Hospital (Seoul, Korea) from January to June 2023. The inclusion criteria were age ≥40 years, open-angles (grade ≥3 Shaffer criteria) on gonioscopy and best-corrected visual acuity better than 20 / 40 and a spherical equivalent between −7 to +3 diopters (D) with a cylinder correction < ±3.0 D. We established a study group of subjects diagnosed with NTG and a separate control group of subjects who had visited the hospital for screening purposes or dry eye disease within the same period. In cases in which both eyes were eligible, one eye was randomly selected.
Diagnosis of NTG was based on the assessment of glaucoma specialists incorporating following clinical evaluation: (1) clinical evidence of optic disc cupping, and thinning of the neuroretinal rim; (2) evidence of peripapillary RNFL loss on spectral-domain OCT; (3) glaucomatous visual field defect defined as the presence of a cluster of three or more non-edge points within p < 0.05 including one or more with p < 0.01 on pattern deviation plot; a pattern standard deviation with p < 0.05, or a glaucoma hemifield test result outside the normal limits in Humphrey visual field (VF) testing; (4) intraocular pressure (IOP) measurement within normal range of 10 to 21 mmHg without antiglaucoma medication; and (5) no clinical history of nonglaucomatous optic neuropathy or retinal pathology. Glaucomatous eyes were graded as early (B, S0), moderate (S1, S2), or severe (S3–S5) based on the Enhanced Glaucoma Staging System (GSS 2) to classify functional damage in glaucoma [16].
The exclusion criteria were as follows: (1) other ocular diseases that may affect VF defects or optic disc abnormalities other than glaucoma; (2) previous ocular surgery history except for uncomplicated cataract surgery; and (3) significant media opacity preventing high-quality imaging. Inclusion criteria for control eyes included the following: (1) no evidence of retinal or optic nerve pathology; (2) an IOP ≤21 mmHg; (3) a normal-appearing ONH, peripapillary RNFL thickness measured on OCT within the 95% confidence interval of the normal distribution; and (4) no VF defects as defined above. Given age as significant risk factor of glaucoma, one-to-one (1:1) case matching was performed, each matched set consisting of one eye from NTG group and one eye from the control group. The control eyes were matched for age (±3 years).
All subjects underwent a comprehensive ophthalmologic examination at the time of enrollment, including a detailed medical history, best-corrected distance visual acuity measurement, Goldmann applanation tonometry, gonioscopic examination, dilated fundus examination, measurements of axial length, anterior chamber depth, and central corneal thickness, Humphrey VF, OCT, and OCTA imaging. Standard automated perimetry (Humphrey SITA Standard 30-2 Protocol, Carl Zeiss Meditec) was performed to evaluate the standard VF (Fig. 1A–1F). Fixation loss of >20% and false-positive or false-negative errors of <15% were excluded to ensure the reliability of the VF test. The mean global sensitivity of VF was described as mean deviation (MD; in dB), pattern standard deviation (PSD; in dB), and VF index (VFI; %). All eyes were scanned using Cirrus HD-OCT (Carl Zeiss, Meditec) to measure the RNFL thickness after pupillary dilation (Fig. 1A–1F). Overall, 90° sectoral RNFL thicknesses (superior, temporal, inferior, and nasal) were determined. Images with a signal strength <8 or with motion artifacts were excluded. IOLMaster 700 (Carl Zeiss Meditec) was used for ocular biometry and a Topcon KR 8800 auto kerato-refractometer (Topcon Corp) was used for autorefraction.
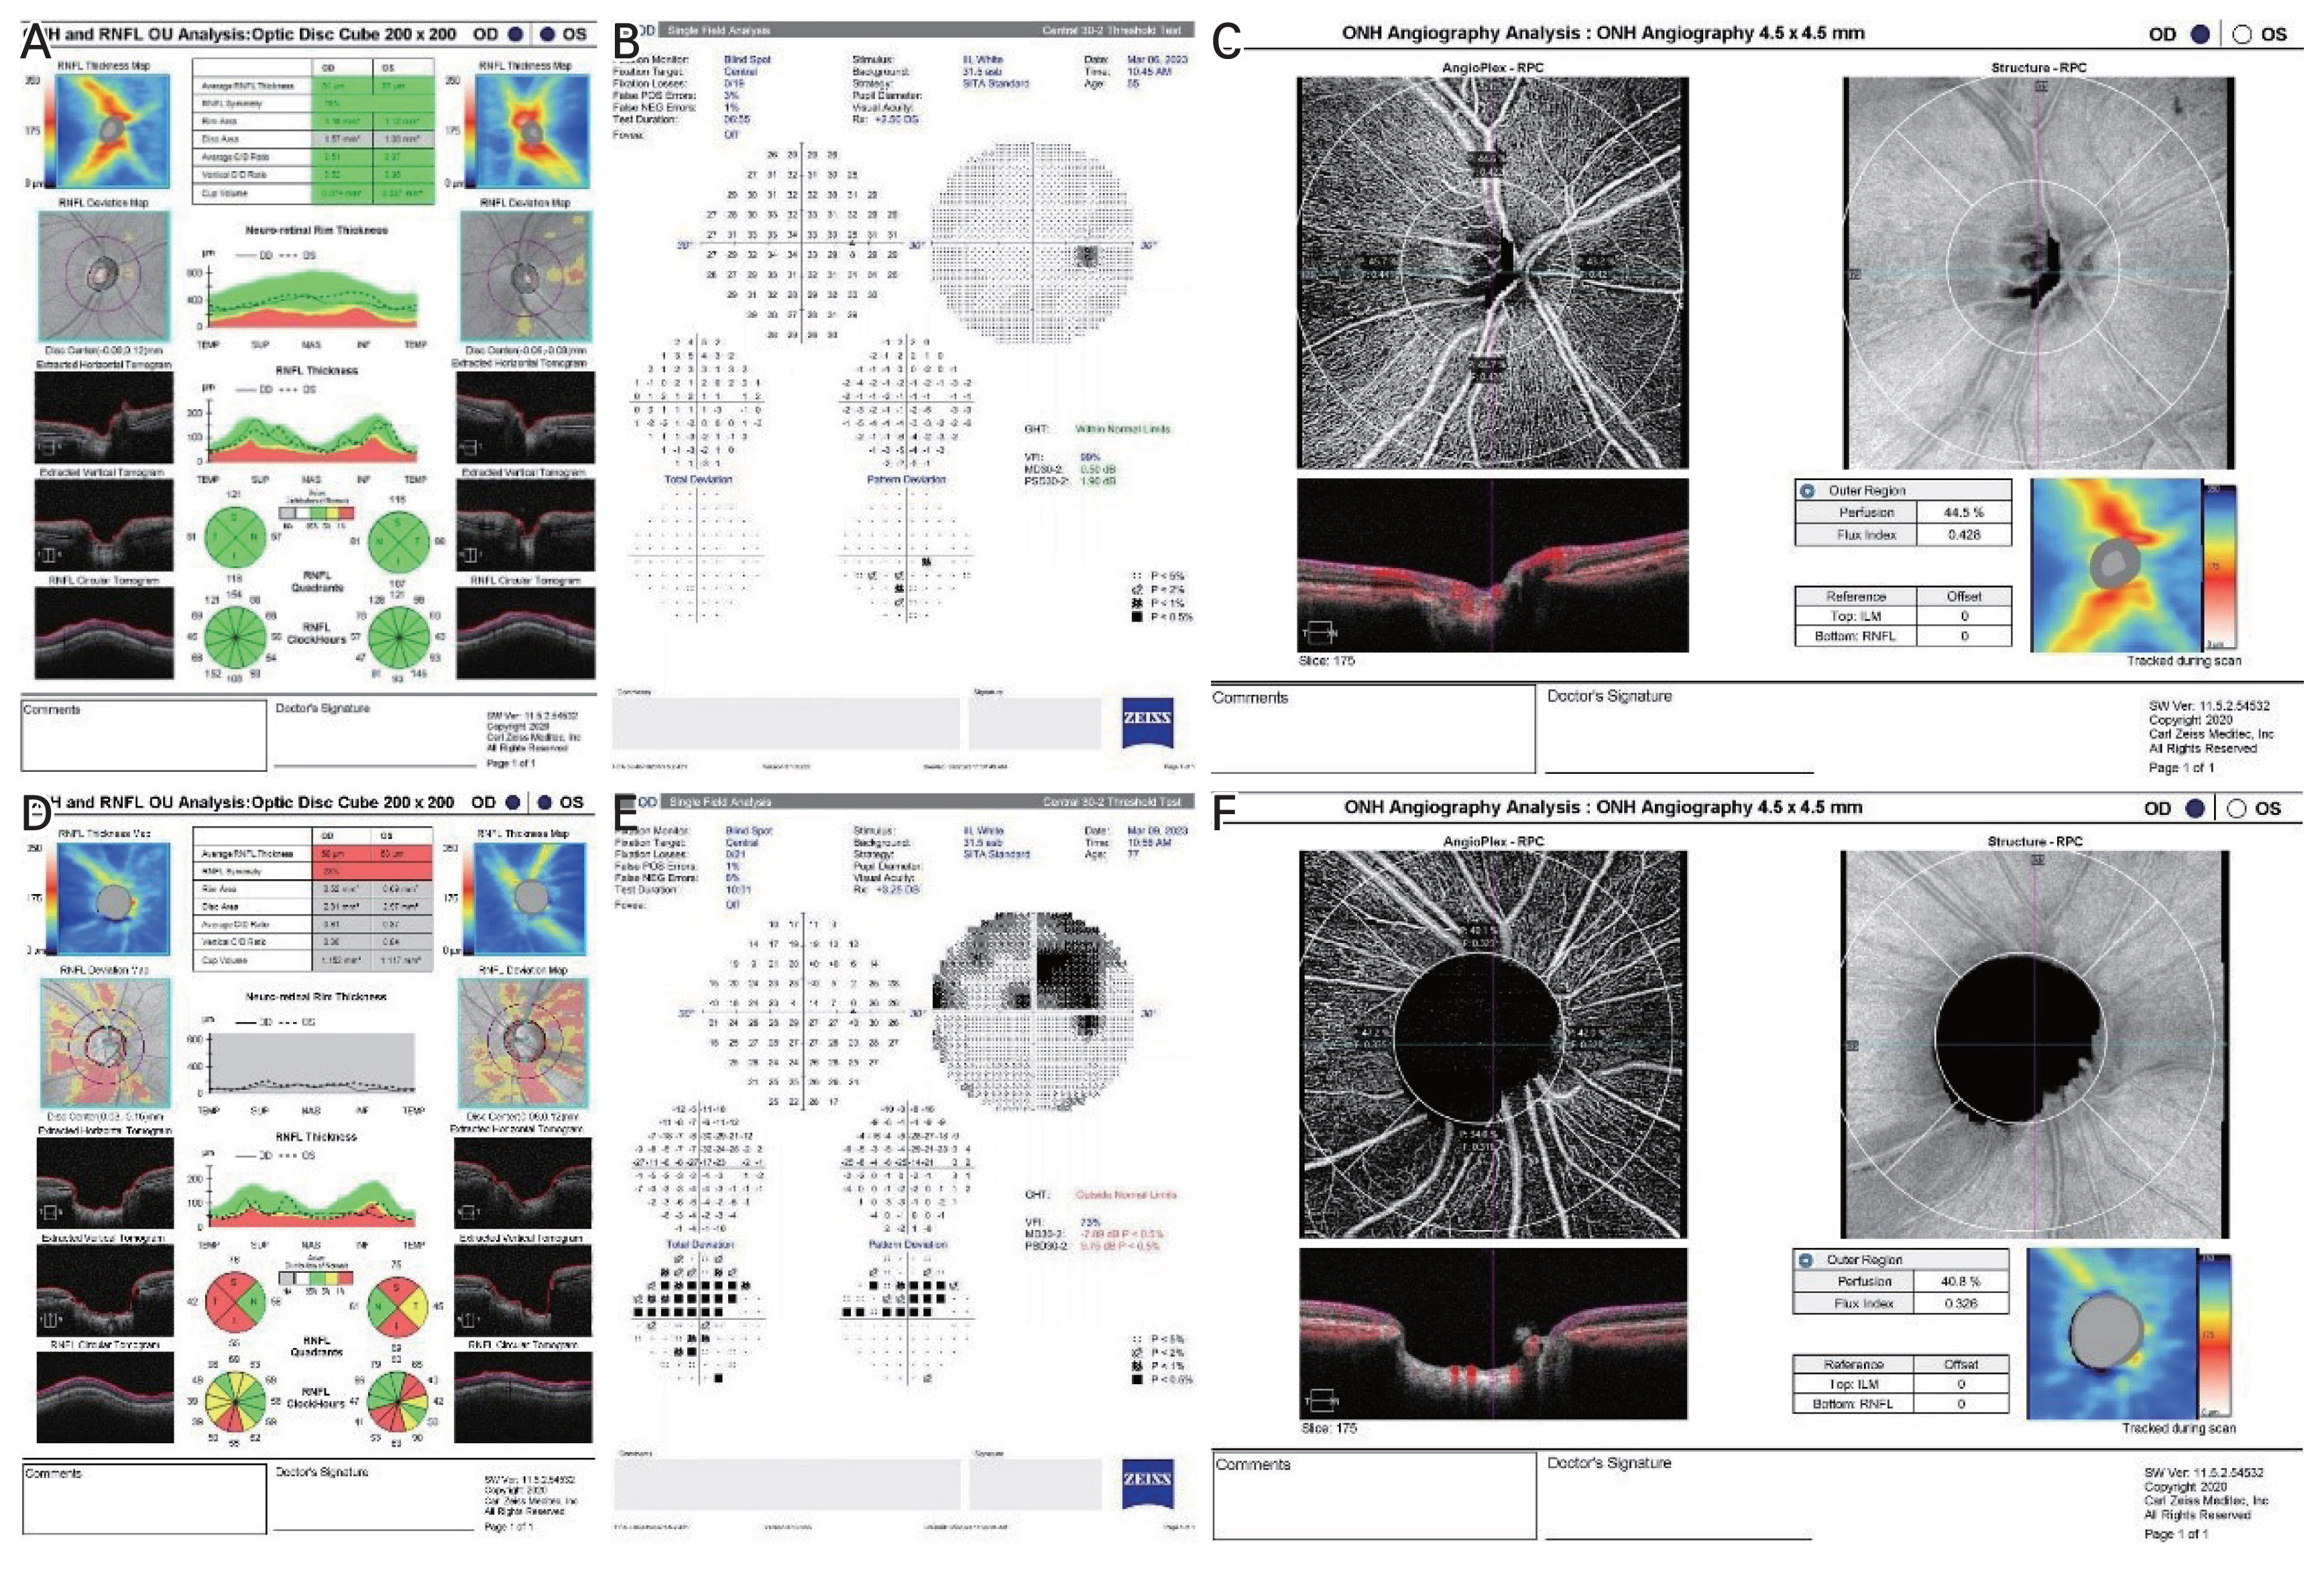
The representative images of optic nerve head analysis obtained with the Cirrus-OCT (Carl Zeiss Meditec), Humphrey 30-2, and optical coherence tomography angiography (OCTA), showing the radial peripapillary capillary obtained by Zeiss AngioPlex (Cirrus HD-OCT 6000, with AngioPlex OCTA 11.5; Carl Zeiss Meditec) based on optical microangiography system. Representative images of (A) retinal nerve fiber layer (RNFL) analysis, (B) standard automated perimetry, and (C) OCTA analysis obtained from the normal control group. Representative images of (D) RNFL analysis, (E) standard automated perimetry, and (F) OCTA analysis obtained from the glaucoma group. (D) There is diffuse loss of RNFL indicated by average RNFL thickness analysis and neuroretinal rim thinning and enlarged cup-disc ratio indicated by vertical cup-disc ratio topographic parameters rim area. (E) Humphrey 30-2 shows marked decrease in mean deviation, pattern standard deviation, and visual field index with visual field defect compatible with the damage seen in the OCT. (F) OCTA image shows marked decrease in perfusion density and flux index of radial peripapillary area.
Optical coherence tomography angiography
The same device used for RNFL measurements was used, and a Zeiss AngioPlex (Cirrus HD-OCT 6000, with AngioPlex OCTA 11.5; Carl Zeiss Meditec) was used based on a microangiography (OMAG) system with active motion- tracking capability were utilized for OCTA. The optic disc OCTA scan covers an area of 4.5 × 4.5 mm centered around the optic disc (Fig. 1, 2A–2C). The optic disc scans were divided into four quadrants: superior, temporal, inferior, and nasal. Vascular parameters in OCTA quantify ONH circulation using the flux index (FI) and perfusion density (PD). The FI was defined as the total weighted area of the perfused microvasculature per unit area in a region of measurement. The PD was defined as the percentage area occupied by the perfused microvasculature in the measured sector. Signal intensity less than eight out of ten or motion artifacts due to poor cooperation of the patient or ocular movement were excluded for the reliability of the test.
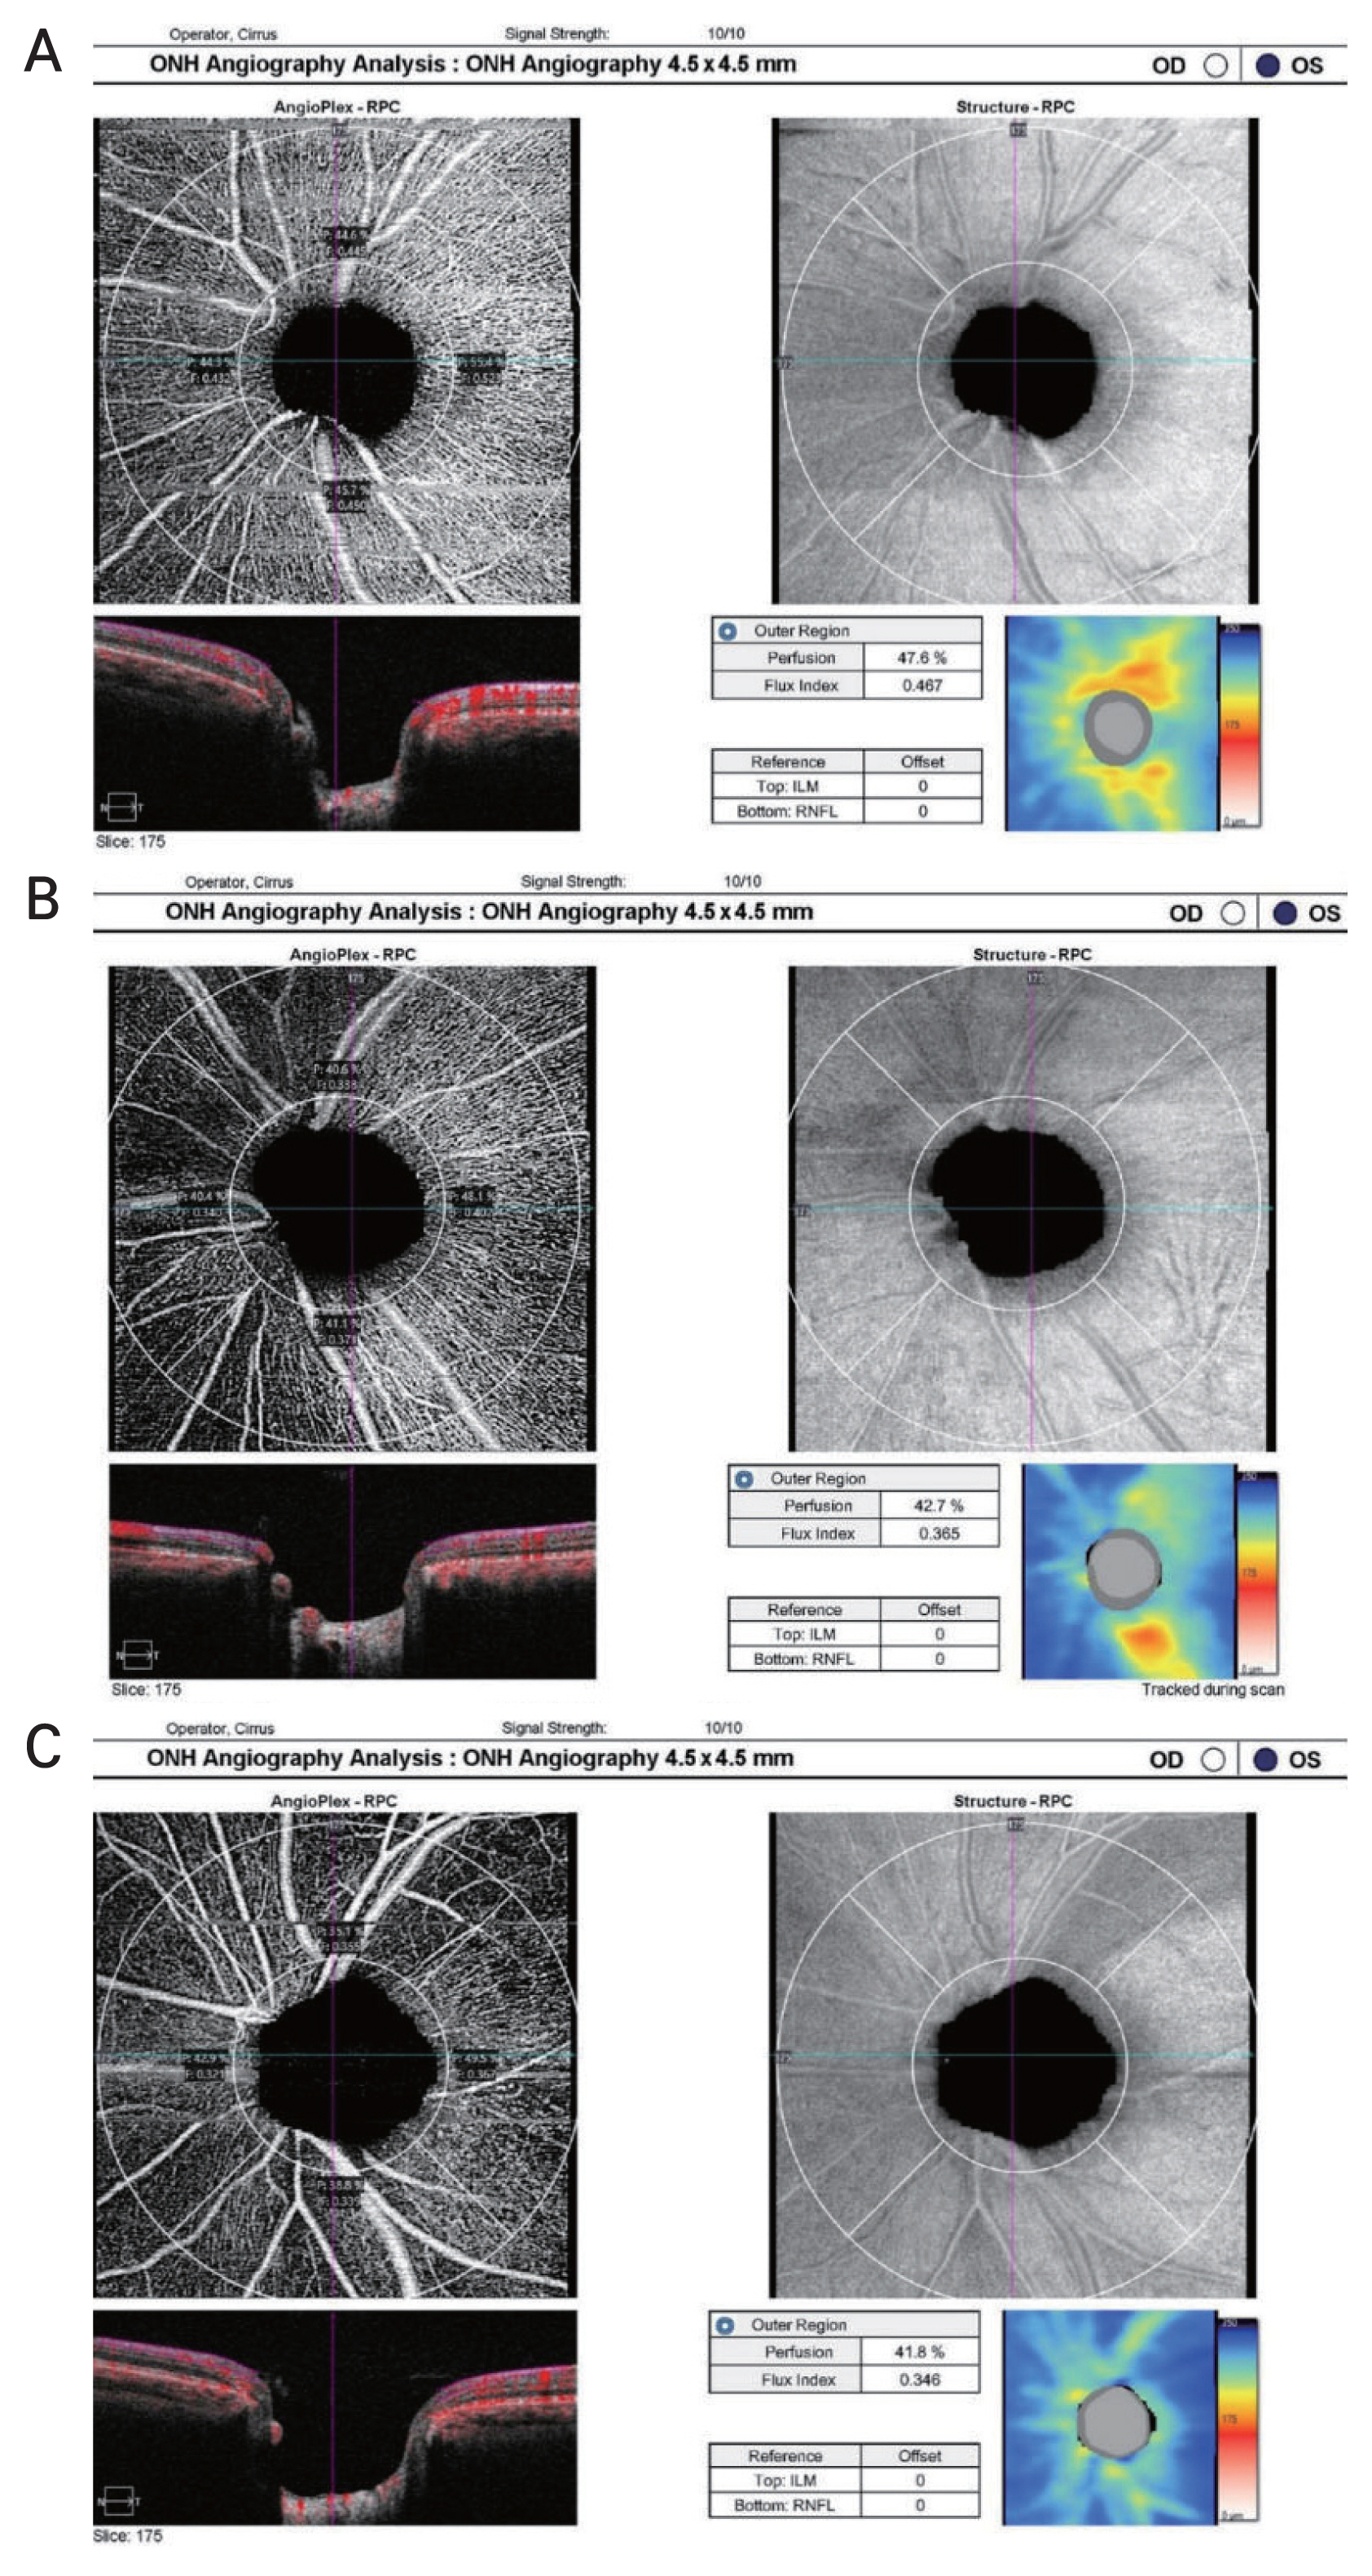
Representative optical coherence tomography angiography results for images of optic nerve head analysis for each subgroup, divided by glaucoma severity based on Enhanced Glaucoma Staging System (GSS 2) for classifying functional damage in glaucoma, showing the radial peripapillary capillary obtained by Zeiss AngioPlex (Cirrus HD-OCT 6000, with AngioPlex OCTA 11.5; Carl Zeiss Meditec) based on optical microangiography system. Quantitative measurements of perfusion density and flux index in peripapillary area is shown. The perfusion density and flux index gradually decreased with glaucoma severity comparing eyes with (A) mild normal tension glaucoma (GSS 2, B–S0) to (B) moderate (GSS 2, S1–S2) and (C) severe (GSS 2, S3–S5). The retinal nerve fiber layer thickness map in each image shows gradual decrease of retinal nerve fiber layer thickness with glaucoma severity.
Statistical analysis
IBM SPSS ver. 26.0 (IBM Corp) was used for statistical analysis. Quantitative variables were expressed as the mean ± standard deviation, and qualitative variables as frequencies. The differences between each measurement indicator were compared using two independent sample t-test for quantitative variables and chi-square test for qualitative variables. Pearson correlation coefficients were calculated to evaluate the spatial correlation between the RNFL thickness and the vascular parameters obtained by OCTA for each sector. The Kruskal-Wallis test was performed to compare the differences in the measurement indicators between the glaucoma subtype groups. Bonferroni post hoc analysis was performed for subgroup analysis. Bonferroni-adjusted significance test for pairwise comparison was applied to correct for type 1 errors, and the adjusted p-value were reported for the results. All tests were two-tailed, and p-values of <0.05 were considered statistically significant. Box plots were used for the visual comparison of the RNFL thickness and the vascular parameters according to glaucoma severity. Scatter plots were used to visualize the correlation between the RNFL thickness and vascular parameters acquired using Pearson correlation coefficients.
Results
A total of 71 eyes from 71 NTG subjects and 71 eyes from 71 normal subjects were matched. For baseline characteristics, differences in terms of age, sex, hypertension, diabetes, and IOP between NTG group and control group were not significant. Differences in central corneal thickness, axial length, and anterior chamber depth between NTG group and control group were not significant (Table 1).

Patient demographics and comparison of structural and functional parameters (n = 142)
For the structural parameters from the OCT images, the average cup-disc ratio was significantly larger (p < 0.001), and the average RNFL thickness and RNFL thickness in all quadrants were significantly decreased in the NTG group compared to that in the control group (p < 0.001 in average and at all quadrants except at the nasal region, p = 0.02 at the nasal region). In the functional parameters from Humphrey VF test, MD and VFI values were significantly lower, and PSD values were significantly higher in the NTG group than in the control group (all p < 0.001) (Table 1).
For the vascular parameters, the average and all sectoral (superior, temporal, inferior, and nasal) PD values were significantly decreased in NTG group than in the control group ( p < 0.001, p = 0.001, p = 0.003, p < 0.001, and p < 0.001, respectively). In addition, significantly decreased average and all sectoral (superior, temporal, inferior, and nasal) FI values were observed in the eyes of the NTG group compared with those of the control group (all p < 0.001 except for temporal region, p = 0.001 for temporal FI) (Table 2).

Comparison between optical coherence tomography angiography parameters (n = 142)
The Pearson correlation coefficient and its significance in relation to the RNFL thickness and the vascular parameters for the corresponding sectors were investigated. The average RNFL thickness positively correlated with the average PD (r = 0.610, p < 0.001) and FI (r = 0.519, p < 0.001). Sectoral RNFL thickness showed the strongest correlation with PD and FI in the inferior region (PD: r = 0.545, p < 0.001; FI: r = 0.454, p < 0.001) and the superior region (PD: r = 0.456, p < 0.001; FI: r = 0.484, p < 0.001). RNFL thicknesses in the temporal (PD: r = 0.361, p < 0.001; FI: r = 0.304, p < 0.001) and nasal (PD: r = 0.256, p = 0.002; FI: r = 0.241, p = 0.004) regions also showed significant correlations with the corresponding PD and FI values (Table 3 and Fig. 3A–3F).

Pearson correlation coefficient of vascular parameters with RNFL thickness for corresponding region
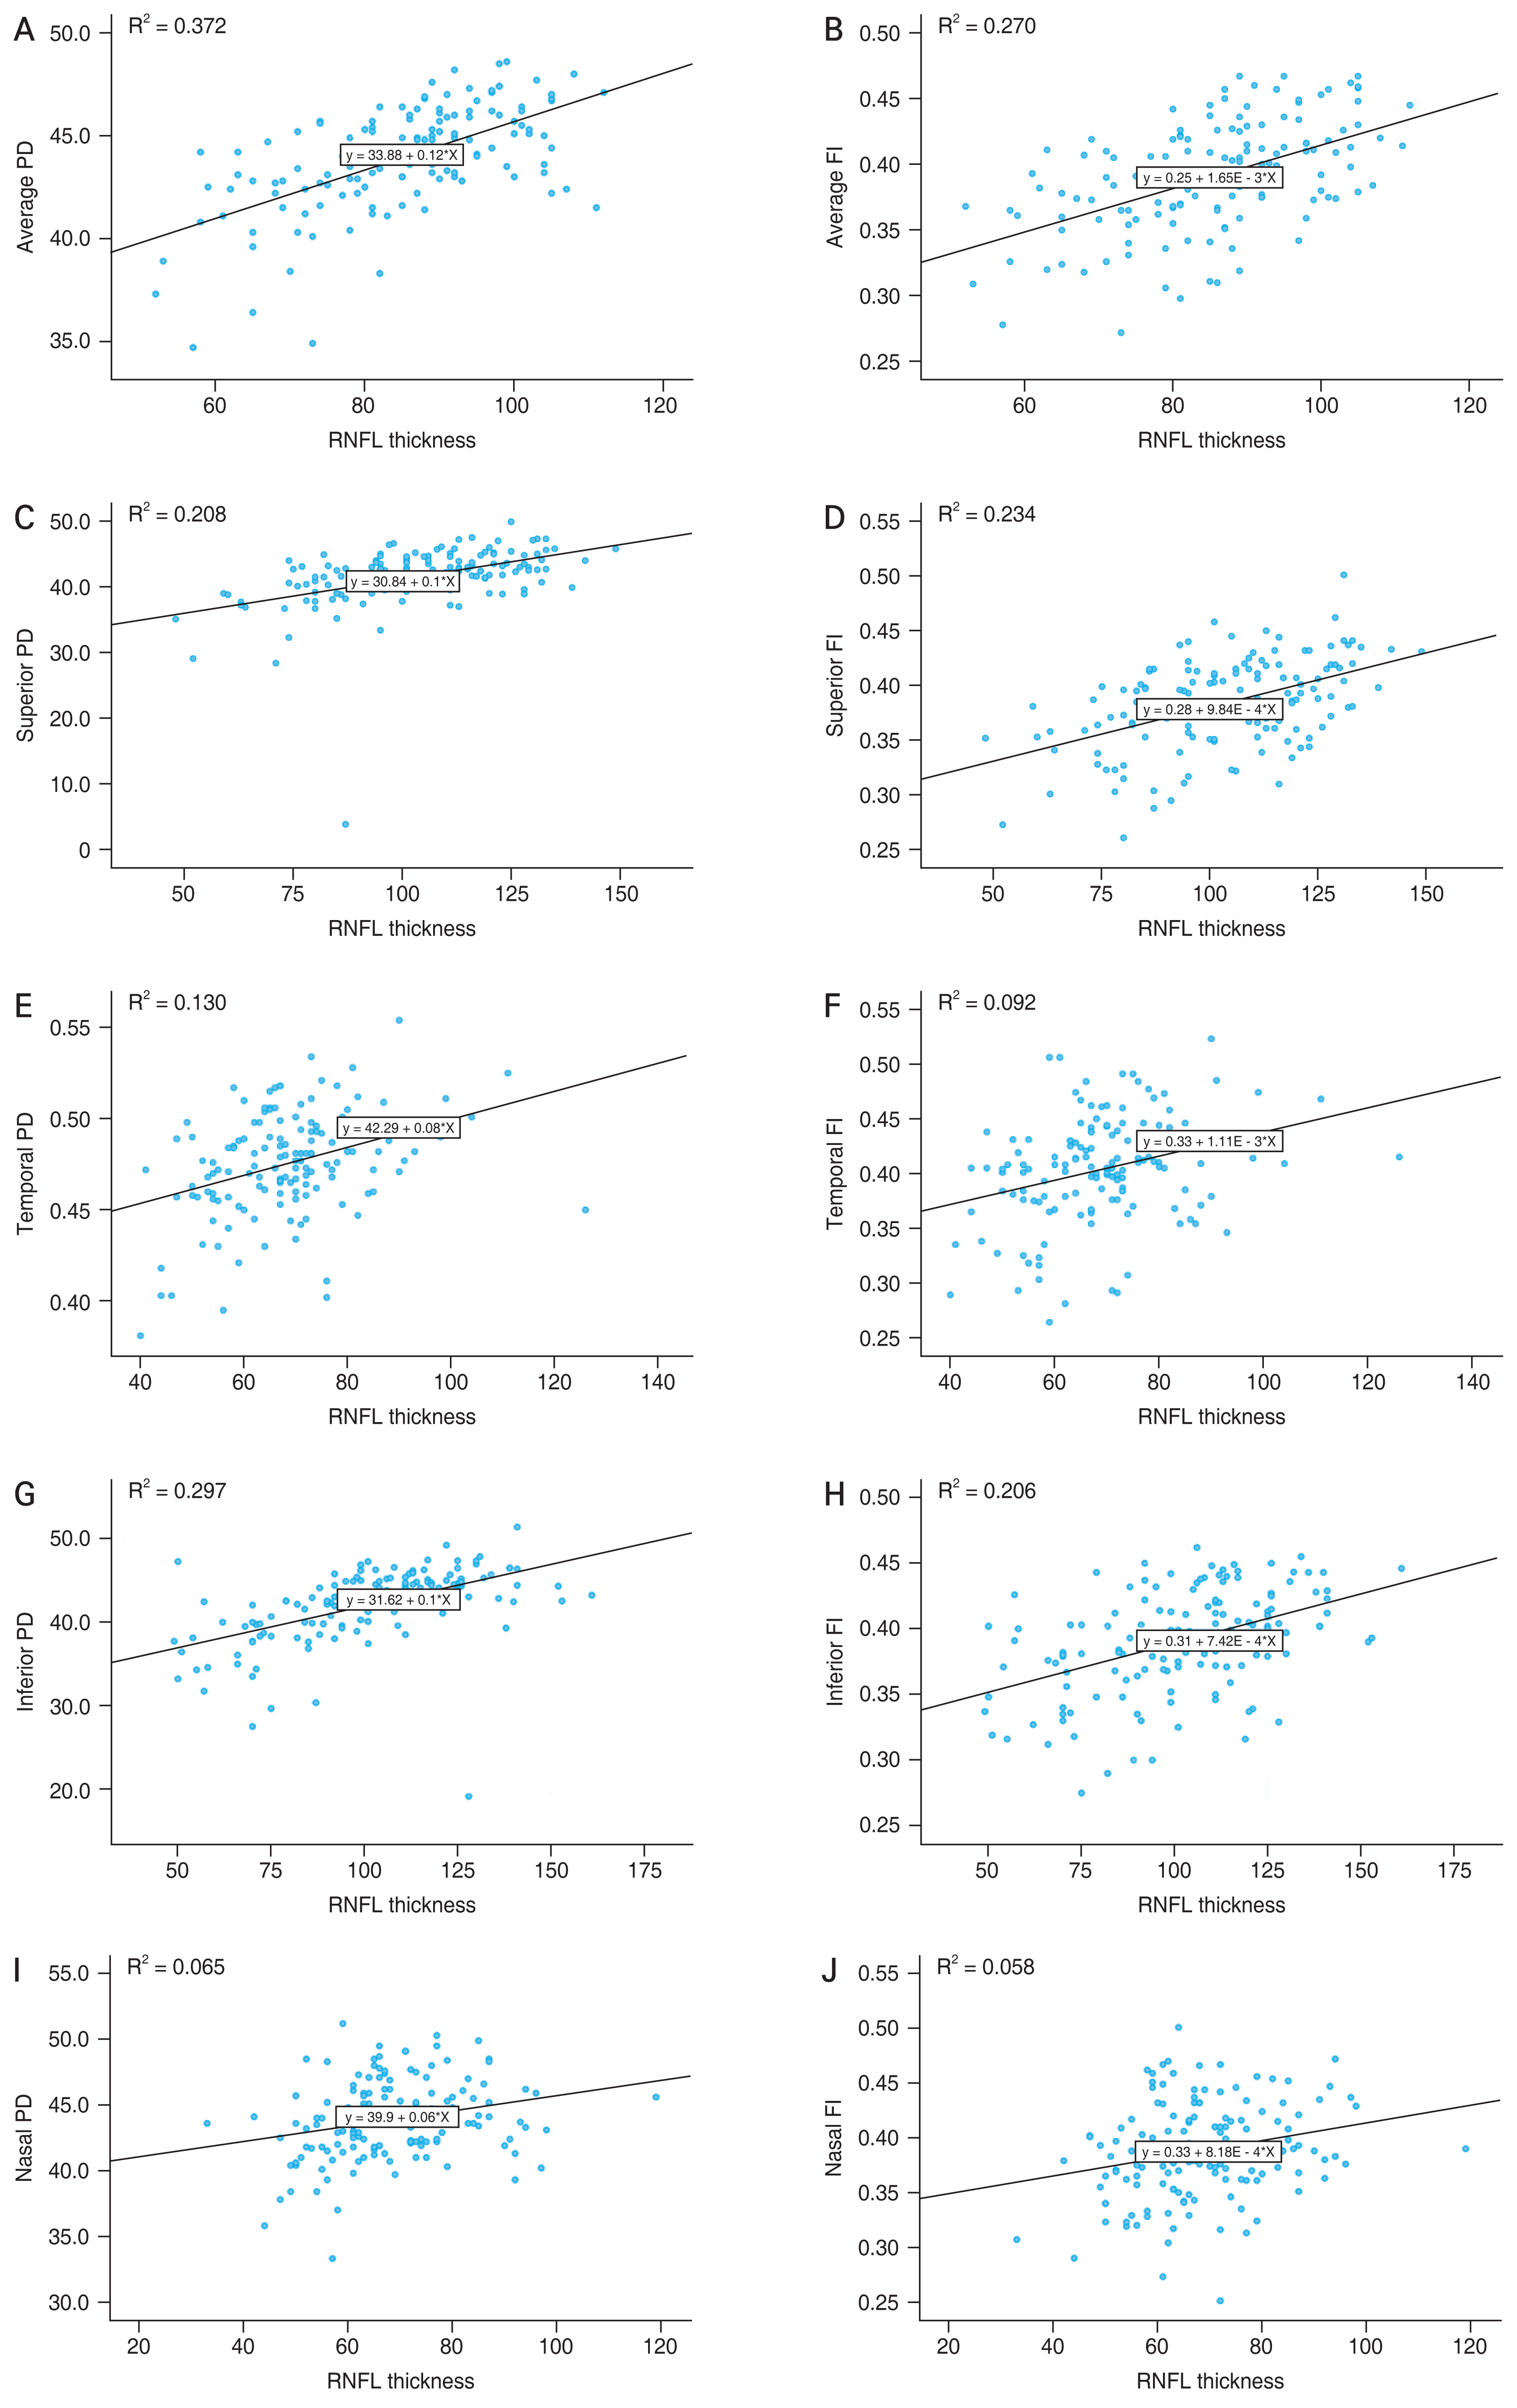
The scatter plot and regression line regarding topographic relationship between retinal nerve fiber layer (RNFL) thickness and optical coherence tomography angiography parameters of each sector. Average (A) perfusion density (PD) and (B) flux index (FI). Superior region (C) PD and (D) FI. Temporal region (E) PD and (F) FI. Inferior region (G) PD and (H) FI. Nasal region (I) PD and (J) FI.
The eyes in the NTG group were divided into three different stages: mild (23 eyes), moderate (27 eyes), and severe (21 eyes). IOP was not significantly different between the groups. The PD decreased significantly globally and topographically in the more advanced NTG group except in the nasal region. In the Bonferroni post hoc analysis, average PD (mild vs. moderate, p = 0.009; mild vs. severe p < 0.001; moderate vs. severe, p = 0.025) and inferior PD (mild vs. moderate, p = 0.012; mild vs. severe, p < 0.001; moderate vs. severe, p = 0.002) showed a significant reduction across all groups. The FI in the inferior and superior regions, were significantly lower in NTG group compared to normal control group (p = 0.04 and p = 0.005, respectively). Further reductions in the average RNFL thickness (p < 0.001) and RNFL thickness in the superior (p = 0.001), temporal (p = 0.001), and inferior (p < 0.001) regions were associated with more advanced disease severity (Table 4).
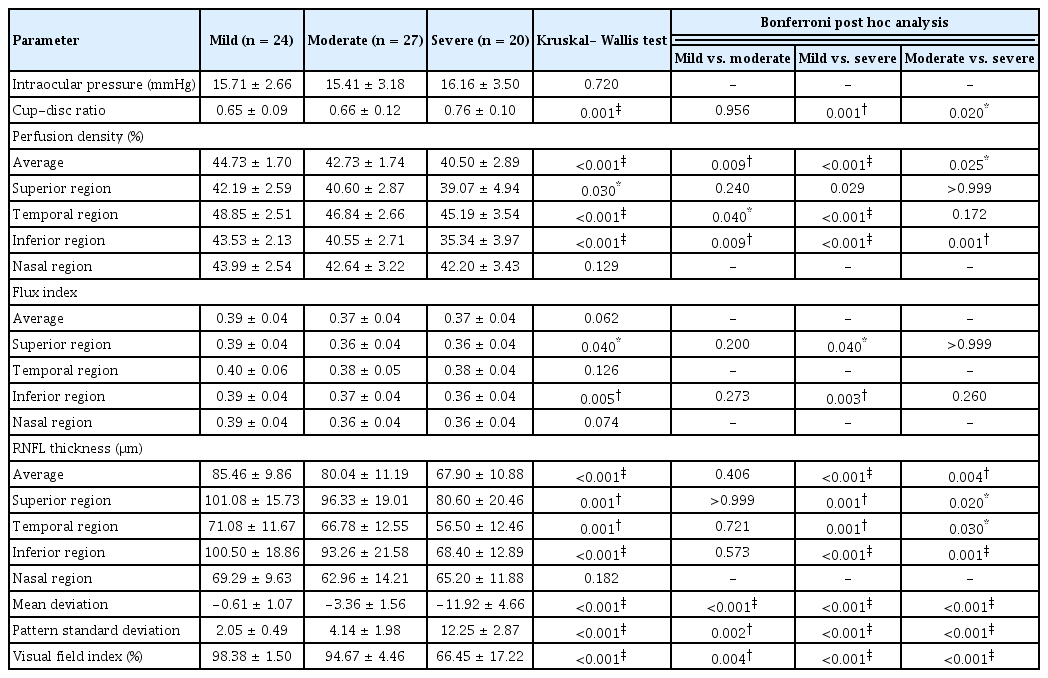
Comparison of intraocular pressure, structural, vascular, and functional parameters between normal tension glaucoma subgroup (n = 71)
The overall distribution of the vascular parameters for the control group and each severity group is shown using a stem-and-leaf diagram (Fig. 4A–4O). The overlapping ranges of the vascular parameters among the different severity levels are shown, as are the structural parameters.

Stem-and-leaf plot for average values of perfusion density (PD), flux index (FI), and retinal nerve fiber layer (RNFL) thickness and values for each parameter in superior, temporal, inferior and nasal quadrants. Average (A) PD, (B) FI, and (C) RNFL thickness. Superior region (D) PD, (E) FI, and (F) RNFL thickness. Temporal region (G) PD, (H) FI, and (I) RNFL thickness. Inferior region (J) PD, (K) FI, and (L) RNFL thickness. Nasal region (M) PD, (N) FI, and (O) RNFL thickness. GSS 2 = Enhanced Glaucoma Staging System.
Discussion
In this study, quantitative changes in retinal peripapillary vascular parameters obtained using OCTA were evaluated in eyes with NTG and compared with those in normal control eyes. We found that the mean PD and FI were significantly lower in patients with NTG than in the control group. Furthermore, when eyes with NTG were divided into subgroups based on disease severity, peripapillary perfusion significantly correlated with the severity of glaucoma. Vascular parameters in the inferior peripapillary region showed the most prominent changes according to glaucoma severity. Our study also showed that PD and FI significantly correlated with RNFL thickness, especially in the inferior sector, further supporting the finding of a prominent decrease in vascular parameters in the inferior sector.
Previous studies using OCTA have revealed that quantitative measurement of vascular dysfunction can be a useful surrogate for quantifying and monitoring RNFL damage in glaucoma. Several studies have shown a significant decrease in peripapillary blood flow and vessel density in glaucomatous eyes compared to normal control eyes [5,7,11,17–20]. The diagnostic ability of vascular parameters is comparable to that of the structural and functional parameters [17,20]. Furthermore, impaired optic nerve perfusion and combined vascular dysfunction significantly correlated with disease severity. The decrease in vessel density and peripapillary perfusion becomes significantly more pronounced as the severity of glaucoma increases [5,11,19]. In addition, the studies measuring vessel diameter from fundus photography showed that the retinal arteriolar narrowing had a significant correlation with glaucomatous optic neuropathy [21,22]. In another study using Doppler OCT, retinal blood flow was significantly reduced in glaucomatous eyes compared with normal eyes [23,24].
Previous studies on the topographic relationship between the peripapillary microvasculature and structural and functional variables also suggested that OCTA is a useful modality for qualifying microvascular changes and monitoring glaucoma progression. Chen et al. [19] showed that eyes with open-angle glaucoma showed significantly lower peripapillary RNFL microcirculation compared to that in normal controls and showed significant correlations with VF indices and OCT structural measurements. Other studies using OCTA have also demonstrated co-localization between regions of decreased peripapillary capillary density, peripapillary RNFL changes, and VF defects [5,11,19,25]. Sehi et al. [24] used doppler spectral-domain OCT to measure retinal blood flow and reported a significant spatial correlation between retinal blood flow, VF defects, and RNFL thickness. On the other hand, reduced blood flow and VF defect showed a closed link that is independent of structural loss in another study using doppler Fourier-domain OCT [23].
In the current study, the PD in the inferior quadrant showed the most prominent decrease across all NTG subgroups in the post hoc analysis. Although the difference in RNFL thickness between the moderate and severe NTG subgroups was not statistically significant, there was a trend of thinning in the inferior quadrant compared with the other quadrants in all NTG subgroups. In a previous analysis [26] in which ONH vessel density was obtained using OCTA with adjusted linear mixed model estimates, a significant decrease in vessel density was observed in the inferior region, followed by the superior region. This result is consistent with the topographical findings of the current study. In another study [27] conducted with Korean patients with NTG, the OCTA results showed a significant decrease in vascular parameters of the superficial capillary flexus, demonstrating a marked decrease in vascular parameters in the inner inferior peripapillary area as well.
The result showed that the structural and vascular parameters in the temporal peripapillary region was relatively preserved in the NTG group. In previous observational studies, the vessel density in the temporal peripapillary region showed a smaller decrease across the open-angle glaucoma stage than that in other sectors [15,25]. Temporal peripapillary perfusion was relatively preserved and corresponded to the area of preserved vision in advanced glaucoma. Previous studies regarding the correlation between RNFL thickness and VF defects also showed the classic pattern of RNFL thinning in the superior and inferior quadrants. Meanwhile the temporal peripapillary RNFL, which feeds the maculopapillary and macular regions corresponding to VF scotomas developed in the late disease course, was relatively preserved [28,29].
In our study, 1:1 case-control matching was used to minimize the effect of age given its significant correlation with glaucoma or RNFL thickness. Meanwhile, previous studies have revealed conflicting result regarding association between age and peripapillary vascular density measure. Jo et al. [30] showed significant age-related peripapillary vascular changes while peripapillary vessel density was not affected by age in the study by Rao et al. [31].
The current study has enrolled patients with NTG for study group. NTG is the most predominant form of glaucoma in Korea and changes in vascular structure and impaired ocular blood flow have been suggested as risk factors for NTG and its progression [12,32]. Since patients with NTG presents with normal IOP, the diagnosis of glaucoma requires a comprehensive approach, including the evaluation of structural damage in the ONH and the corresponding functional damage [1]. Optic nerve damage followed by insufficient blood supply is known to be more strongly associated with NTG than POAG [8]. Peripapillary vascular parameter showed weaker correlation with VF parameters in eyes with POAG than in those with NTG [33]. Therefore, vascular parameters may provide clinical information about compromised vasculature and microcirculation in patients with NTG, complementing the VF and OCT to diagnose glaucoma and assess the risk of progression. In a study by Kallab et al. [34], the combination of RNFL thickness and capillary density showed better focal structure-function correlations with VF defects than vascular or structural factors alone. The value of OCTA as an auxiliary diagnostic tool is expected to be more meaningful in situations where the usefulness of preexisting imaging devices is limited. For example, the structure-function correlation between RNFL thickness and VF defects has been reported to have relatively low significance, particularly in eyes with advanced glaucoma [34]. As the GCIPL thickness can provide useful information for determining the progression of glaucoma in patients with advanced glaucoma whose peripapillary RNFL thickness has reached the floor values, further research is needed to evaluate whether the vascular parameters measured by OCTA can provide valuable information for determining disease progression. In addition, highly myopic eyes tend to have tilted ONHs and parapapillary atrophy or are often accompanied by diffuse RNFL thinning. These confounding structural changes found in highly myopic eyes often limit the accuracy of imaging modalities or the interpretation of VF tests [32,35]. In such contexts, peripapillary vascular parameters may be useful as complementary imaging modalities to improve diagnostic accuracy. However, the association with structure and functional parameters should further be studied since OCTA is relatively new technology with only a few, small, longitudinal studies performed [5].
The imaging modality used in our study, Zeiss Angio-Plex based on the OMAG system, is a spectral-domain OCTA with complex signal-based OMAG and is one of the most widely used commercially available OCT systems in actual clinical settings. Past studies have shown better repeatability and reproducibility in 4.5 × 4.5-mm sized scans of the radial peripapillary capillary plexus and macula compared to the 6 × 6-mm sized images of the previous version [4,36]. The results of the study using peripapillary images were similar even when the scans were taken from the same clinical setting using the same technology [36]. The significance of the current study lies in the examination of the values of vascular parameters derived from the most commercially available OCTA in glaucoma clinics and the investigation of the correlation of vascular parameters with representative structural and functional parameters.
As the current study has a relatively small sample size limited to the Korean population, there may be limitations in generalizing the results of this study to the broader glaucoma population. Moreover, the retrospective cross-sectional study design may have been subject to biases and limitations inherent to the data. To overcome the limitations of this study’s cross-sectional design, unreliable OCTA images with significant motion artifacts or structural defects were excluded. Previous studies have also shown that OCTA measurements have reasonable intra- visit repeatability and inter-visit reproducibility [4,36– 38]. Due to the limitations of its cross-sectional study design, the current study did not include patients with preperimetric glaucoma or glaucoma suspects which could have potentially altered the diagnostic ability of OCTA. Finally, the factors that could alter ocular blood flow were not completely controlled in this study. Comorbidities such as hypertension and diabetes mellitus, however, were not significantly different between the study and control groups [39]. Because previous studies have demonstrated that IOP-lowering eye drops help decrease IOP but may increase blood flow of ONH in patients with NTG, it is important to note that the use of IOP-lowering eye drops might have influenced the results [40,41]. However, the number of affected subjects was small, and results of statistical analysis after excluding them were not significantly different (Supplementary Tables 1, 2). Still, further studies will be required to determine the longitudinal relationship of peripapillary perfusion with the progression of glaucoma, especially in patients with concomitant vascular risk factors or those with disc hemorrhage.
In the current study, the vascular parameters obtained using OCTA were significantly decreased in glaucomatous eyes, and the degree of decrease in the vascular parameters was proportional to the severity of glaucoma. Peripapillary vessel density and flow index detected using OCTA may complement other structural and functional measurements in the diagnosis of glaucoma.
Acknowledgements
None.
Notes
Conflicts of Interest
None.
Funding
None.
Supplementary Materials
Supplementary Table 1. Comparison between optical coherence tomography angiography parameters (n = 142)
kjo-2023-0112-Supplementary-Table-1.pdfSupplementary Table 2. Pearson correlation coefficient of vascular parameters with RNFL thickness for corresponding region
kjo-2023-0112-Supplementary-Table-2.pdfSupplementary materials are available from https://doi.org/10.3341/kjo.2023.0112.