Prevalence Ratio of Primary Angle-Closure and Primary Open-Angle Glaucoma in Asian Population: A Meta-Analysis and Multiple Meta-Regression Analysis
Article information
Abstract
Purpose
To investigate the prevalence ratio of primary angle-closure glaucoma (PACG) and primary open-angle glaucoma (POAG) in the Asian population.
Methods
Systematic searches of PubMed, Embase, and Cochrane databases for population-based studies in Asia published until August 5, 2022. We conducted a meta-analysis for PACG to POAG prevalence ratio using inverse variance–weighted random-effects meta-analyses so as to combine the study-specific measures of association. Between-study outcome variation (i.e., heterogeneity) was quantified with the I2 statistic. The multiple meta-regression analyses were performed in order to further account for the reasons for heterogeneity.
Results
Twenty studies, with a total study population of 52,522 individuals, had been conducted in 13 countries. The pooled PACG to POAG prevalence ratio was 2.204 (95% confidence interval, 1.617–3.004) with high heterogeneity (p < 0.001). In multiple meta-regression model, prevalence of POAG is the most important predictor for heterogeneity (model importance, 0.954), followed continent (0.508), and publication year (0.222). For every additional elevation of POAG prevalence (i.e., increase of 1.0%), the PACG to POAG prevalence ratio is expected to rise by 0.471.
Conclusions
We estimated the pooled PACG to POAG prevalence ratio in the Asian population. The POAG prevalence is the most important factor to determine the PACG to POAG prevalence ratio.
Glaucoma is a group of optic neuropathies characterized by progressive degeneration of the optic nerve, resulting in visual field loss and, if untreated, irreversible blindness [1]. It is estimated that 79.6 million people worldwide will have glaucoma by 2020, with the majority of cases occurring in Asia [2]. Primary angle-closure glaucoma (PACG) and primary open-angle glaucoma (POAG) are the two main types of glaucoma, and their relative prevalence varies across different populations [3]. PACG is more prevalent in Asian population, while POAG is more prevalent in Western population [4,5]. However, there is significant variation in the prevalence of PACG and POAG across different populations, and the reasons for this variation are not fully understood.
Understanding the relative prevalence of PACG and POAG is important for the development of effective public health policies and interventions aimed at reducing the burden of glaucoma. Several studies have investigated the prevalence of PACG and POAG in different populations, and have identified genetic, environmental, and lifestyle factors as potential contributors to the variation in the prevalence of these conditions [6–8]. However, there is still considerable debate about the relative prevalence of PACG and POAG in different populations, and a comprehensive meta-analysis is needed to synthesize the available evidence.
In this study, we conducted a meta-analysis and multiple meta-regression analysis to investigate the prevalence ratio of PACG and POAG in Asian population. We aimed to identify the factors that contribute to the variation in the prevalence ratio of these conditions across different populations, and to provide a basis for the development of public health policies and interventions aimed at reducing the burden of glaucoma in Asian population.
Materials and Methods
Ethics statement
This study was conducted under the guidance of PRISMA (Preferred Reporting Items for Systematic Reviews and Meta-Analyses) [9]. Research that consist of a meta-analysis are exempt from the need for Institutional Review Board approval [10].
Search strategy and study selection
The PubMed, Embase, and Cochrane search engines were referenced in order to identify the relevant studies. The search items selected were based on an established terminology that included the MeSH (Medical Subject Headings) and Embase extensive search terms whenever possible. The keywords were as follows: glaucoma, open-angle glaucoma, angle-closure glaucoma, and prevalence. Two reviewers (JL, JSP) independently screened the titles and abstracts. The full texts were sourced for the relevant articles. The inclusion criteria were independently assessed, and any inconsistencies were resolved via consensus. We also manually reviewed the retrieved articles’ reference lists to identify additional relevant studies. The databases were searched for reports that had been published through August 5, 2022. The flowchart which summarizes the study selection process is shown in Supplementary Fig. 1.
Our aim was to identify all population-based studies that had reported the prevalence of both POAG and PACG simultaneously in Asian adults aged 18 years or older. Excluded were the following studies: (1) studies not conducted with humans or adults; (2) narrative and/or systematic reviews, commentaries, abstracts, and case reports; (3) lacking any detailed glaucoma assessment explanation; and (4) studies not conducted in Asia. In cases where more than one study had been published by a single institution, we confirmed their independence and absence of overlap in their research subjects or methods.
Data extraction and quality assessment
Two investigators (YJ and YIS) extracted data in an independent and masked manner using a standardized method of data extraction based on the ones employed by the Cochrane Database of Systematic Reviews (Review Manager ver. 4.1.1). The following study data were extracted: (1) name of first author; (2) year of publication; (3) race/ethnicity of study population; (4) country of study; (5) number of subjects; (6) ages and sexes of participants; (7) number of patients with POAG; and (8) number of patients with PACG.
Statistical analysis
We conducted a meta-analysis for prevalence ratio of PACG and POAG using inverse variance–weighted random-effects meta-analyses so as to combine the study-specific measures of association. Between-study outcome variation (i.e., heterogeneity) was quantified with the I2 statistic, which describes the percentage variation across studies due to heterogeneity rather than to chance, regardless of the treatment effect metric [11].
In subgroup analysis by the random-effects model for between-subgroup differences, we looked at subgroups differing by the following: (1) number of study population; (2) baseline mean age; (3) prevalence of POAG; (4) continents; and (5) publication year.
The meta-regression analysis entailing the random-effects model were performed in order to further account for the reasons for heterogeneity [12]. Each moderator was included in the random-effects univariate meta-regression analysis by maximum likelihood estimation. The covariates included were as follows: (1) study population; (2) baseline mean age; (3) prevalence of POAG; (4) continents; and (5) publication year. In multiple meta-regression [13], we modeled with all possible predictor combinations to examine the possible predictor combination which provides the best fit and identify the most important predictor.
Publication bias was graphically evaluated with funnel plots and statistically evaluated with Egger linear regression method test [14,15]. This test determines if there is any significant correlation between effect estimates and their variances. The absence of such correlation suggests that studies were selected in an unbiased way.
Data handling and the statistical analyses were performed by one independent data analyst (MGH). The meta-analysis was performed with R ver. 4.1.4 (R Foundation for Statistical Computing). A p < 0.05 were considered to be statistically significant. All p-values and 95% confidence intervals (CIs) were two-sided.
Results
Search results and study characteristics
The search of articles published before August 5, 2022, returned 973 results. After the title and abstract screening, 47 articles were found to be potentially relevant. Following the thorough full-text review, 20 studies were selected (Table 1) [16–39]. All studies were of population-based design, had originated from Asian countries.

Characteristics of studies included in the meta-analysis
The 20 studies, with a total study population of 52,522 individuals, had been conducted in 13 countries: five studies in China [16–21], three in India [22–25], two in South Korea [26–28], and one study each in Japan [29, 30], Myanmar [31], Singapore [32], Sri Lanka [33], Bangladesh [34], Thailand [35], Nepal [36], Mongolia [37] , Iran [38], and Laos [39]. The characteristics of all of the included studies are summarized in Table 1 [16–39].
Overall summary measurement
The pooled PACG to POAG prevalence ratio was 2.204 (95% CI, 1.617–3.004) with high heterogeneity (I2 = 100%, p < 0.001). Fig. 1 and 2 provide the relevant forest plot (a graphical display of the observed effect and 95% CI) and drapery plot (a confidence curve is plotted for each study, as well as for the average effect) [16–39].
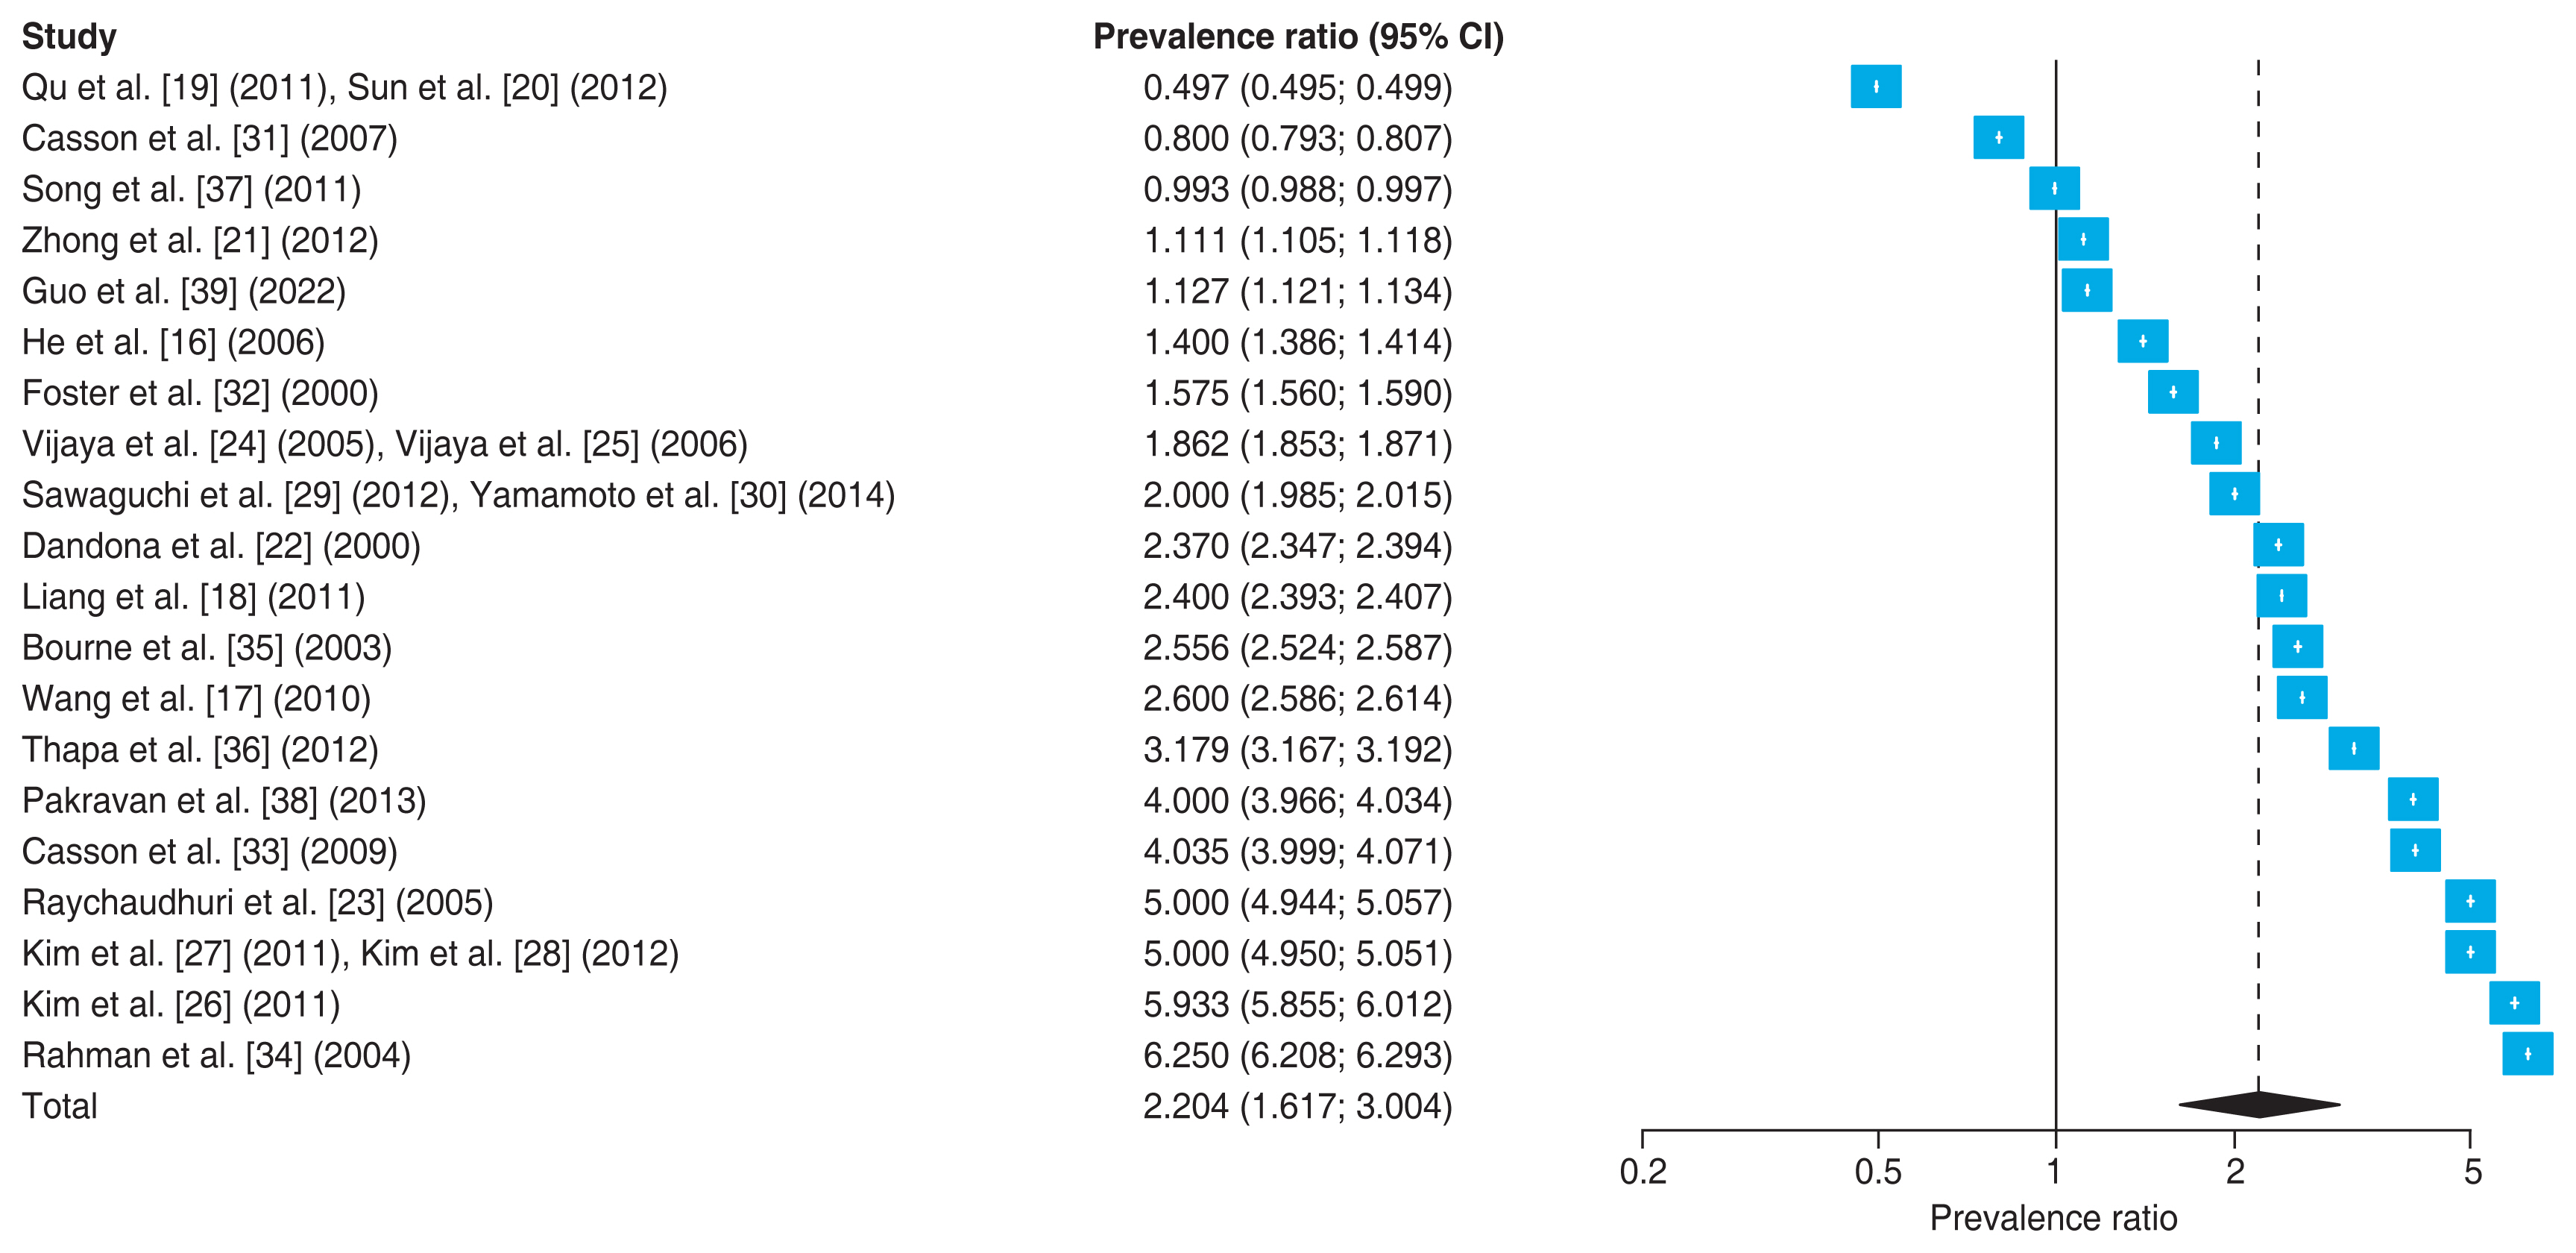
Forest plot of primary angle-closure glaucoma to primary open-angle glaucoma prevalence ratio in Asian population. The diamond denotes the pooled ratio, and the lateral tips of the diamond indicate the associated confidence intervals (CIs).
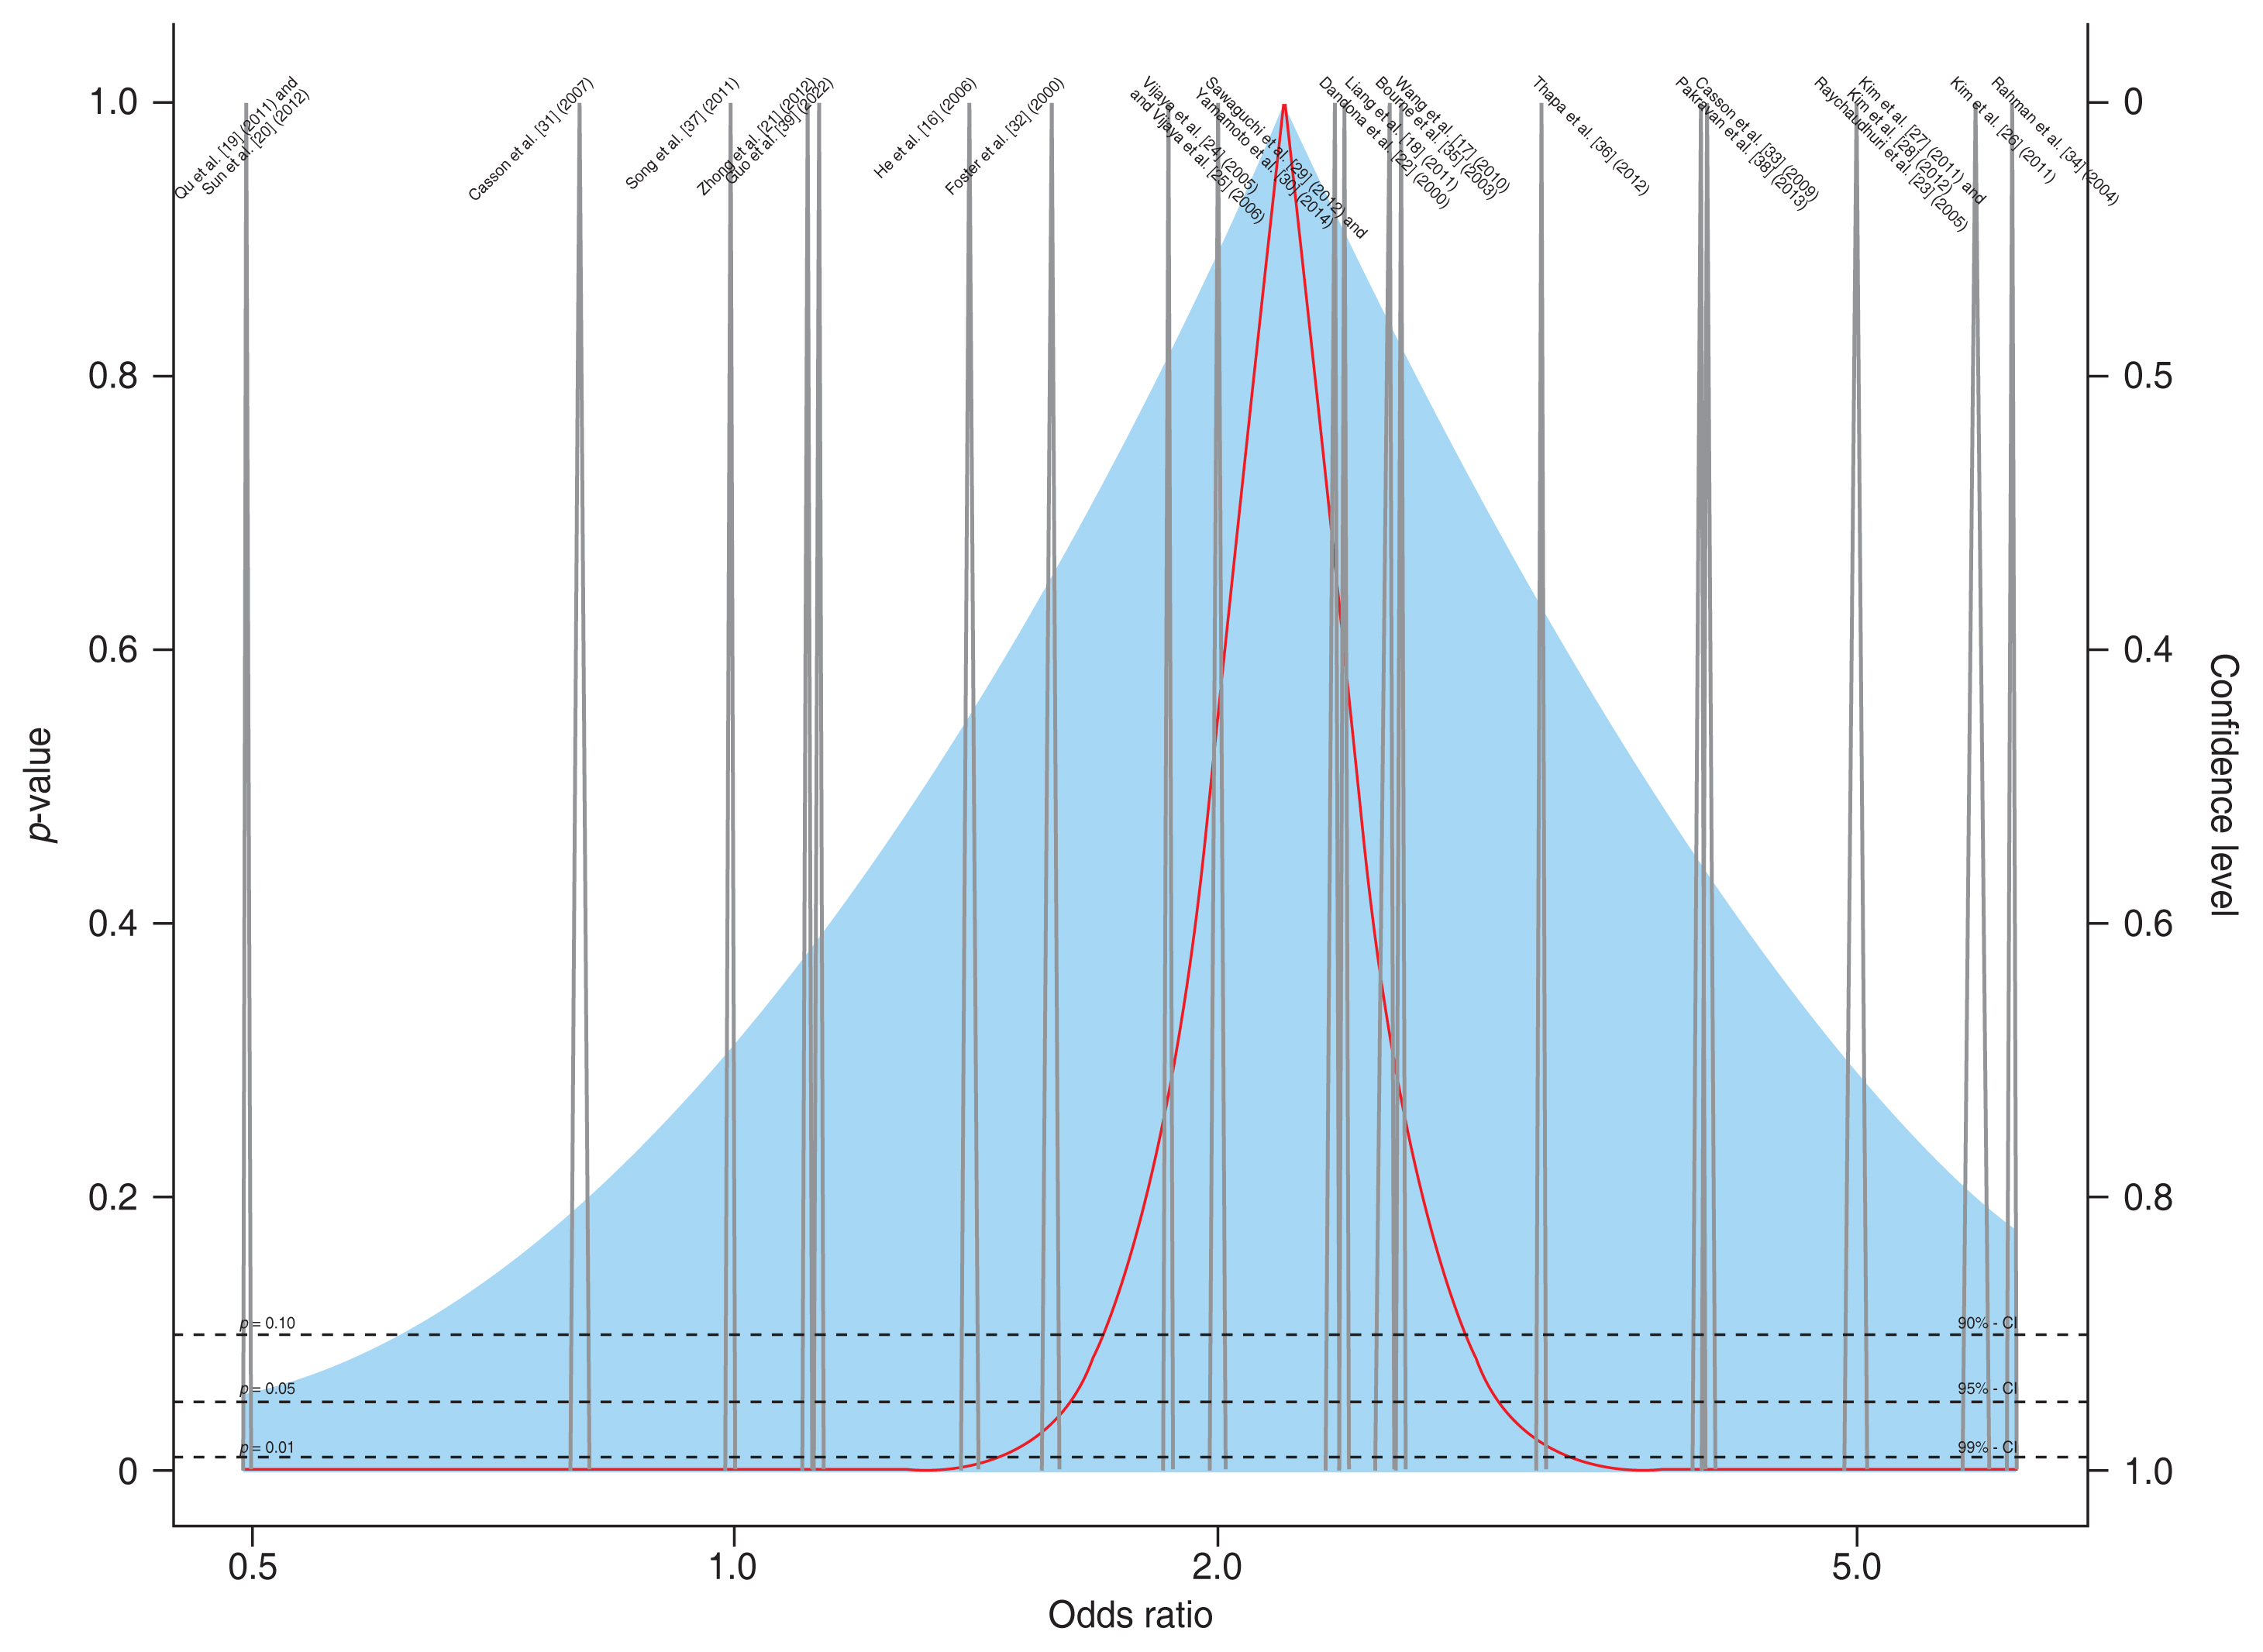
Drapery plot of primary angle-closure glaucoma to primary open-angle glaucoma prevalence ratio in Asian population. The resulting plot contains a p-value curve for each effect size, all in the shape of an upside-down V. The thick line represents the average effect according to the random-effects model. The shaded area we see in the plot represents the prediction interval, which is considerably wider than the confidence interval of the pooled effect. The “peak” of the p-value functions represents the exact value of the effect size in our meta-analysis.
Subgroup analysis
We performed subgroup analyses to investigate the potential sources (i.e., number of study population, baseline mean age, prevalence of POAG, continents, and publication year) of between-study heterogeneity. The subgroup analysis according to prevalence of POAG (i.e., <2.0% vs. ≥2.0%) showed relatively higher PACG to POAG prevalence ratio for ≥2.0% (3.00; 95% CI, 2.106–4.270) compared with <2.0% (1.39; 95% CI, 0.930–2.075), with statistical significance (Q = 7.96, p < 0.001). However, the PACG to POAG prevalence ratio between studies did not reflect any statistical significance among subgroups by number of study population, baseline mean age, continents, and publication year (all p > 0.01).
Univariate meta-regression analysis
The subgroup analyses showed a possible modulating influence of prevalence of POAG. Thus, we performed a random-effects meta-regression analysis to see that the estimate of the heterogeneity variance that is explained by the predictor (i.e., prevalence of POAG). The model’s estimate of the regression weight for elevation of POAG prevalence is 0.471 (Fig. 3). This means that for every additional elevation of POAG prevalence (i.e., increase of 1.0%), the effect size of a study is expected to rise by 0.471. Therefore, we can say that the POAG prevalence of studies have a positive association with PACG to POAG prevalence ratio. The 95% CI ranges from 0.191 to 0.751, showing that the effect is significant (p < 0.001).

Bubble plot for visualizing a meta-regression. The resulting plot shows the estimated regression slope, as well as the effect size of each study (i.e., primary angle-closure glaucoma [PACG] to primary open-angle glaucoma [POAG] prevalence ratio) according to the covariate (i.e., prevalence of POAG). To indicate the weight of a study, the bubbles have different sizes, with a greater size representing a higher weight.
Multiple meta-regression analysis
In multiple meta-regression model, possible predictor combination provides the best fit was prevalence of POAG and continent (corrected Akaike information criterion [AIC], 37.3). In Fig. 4, the averaged importance of each predictor across all models is displayed. Prevalence of POAG (model importance, 0.954) is the most important predictor, followed continent (model importance, 0.508) and publication year (model importance, 0.222).

Model-averaged predictor importance plot. The averaged importance of each predictor across all models is displayed. POAG = primary open-angle glaucoma.
Publication bias
Fig. 5 is the funnel plot depicting publication bias. No publication bias was evident in this visual examination of plot symmetry. Likewise, there was no evidence of publication bias by the Egger test (p = 0.321).
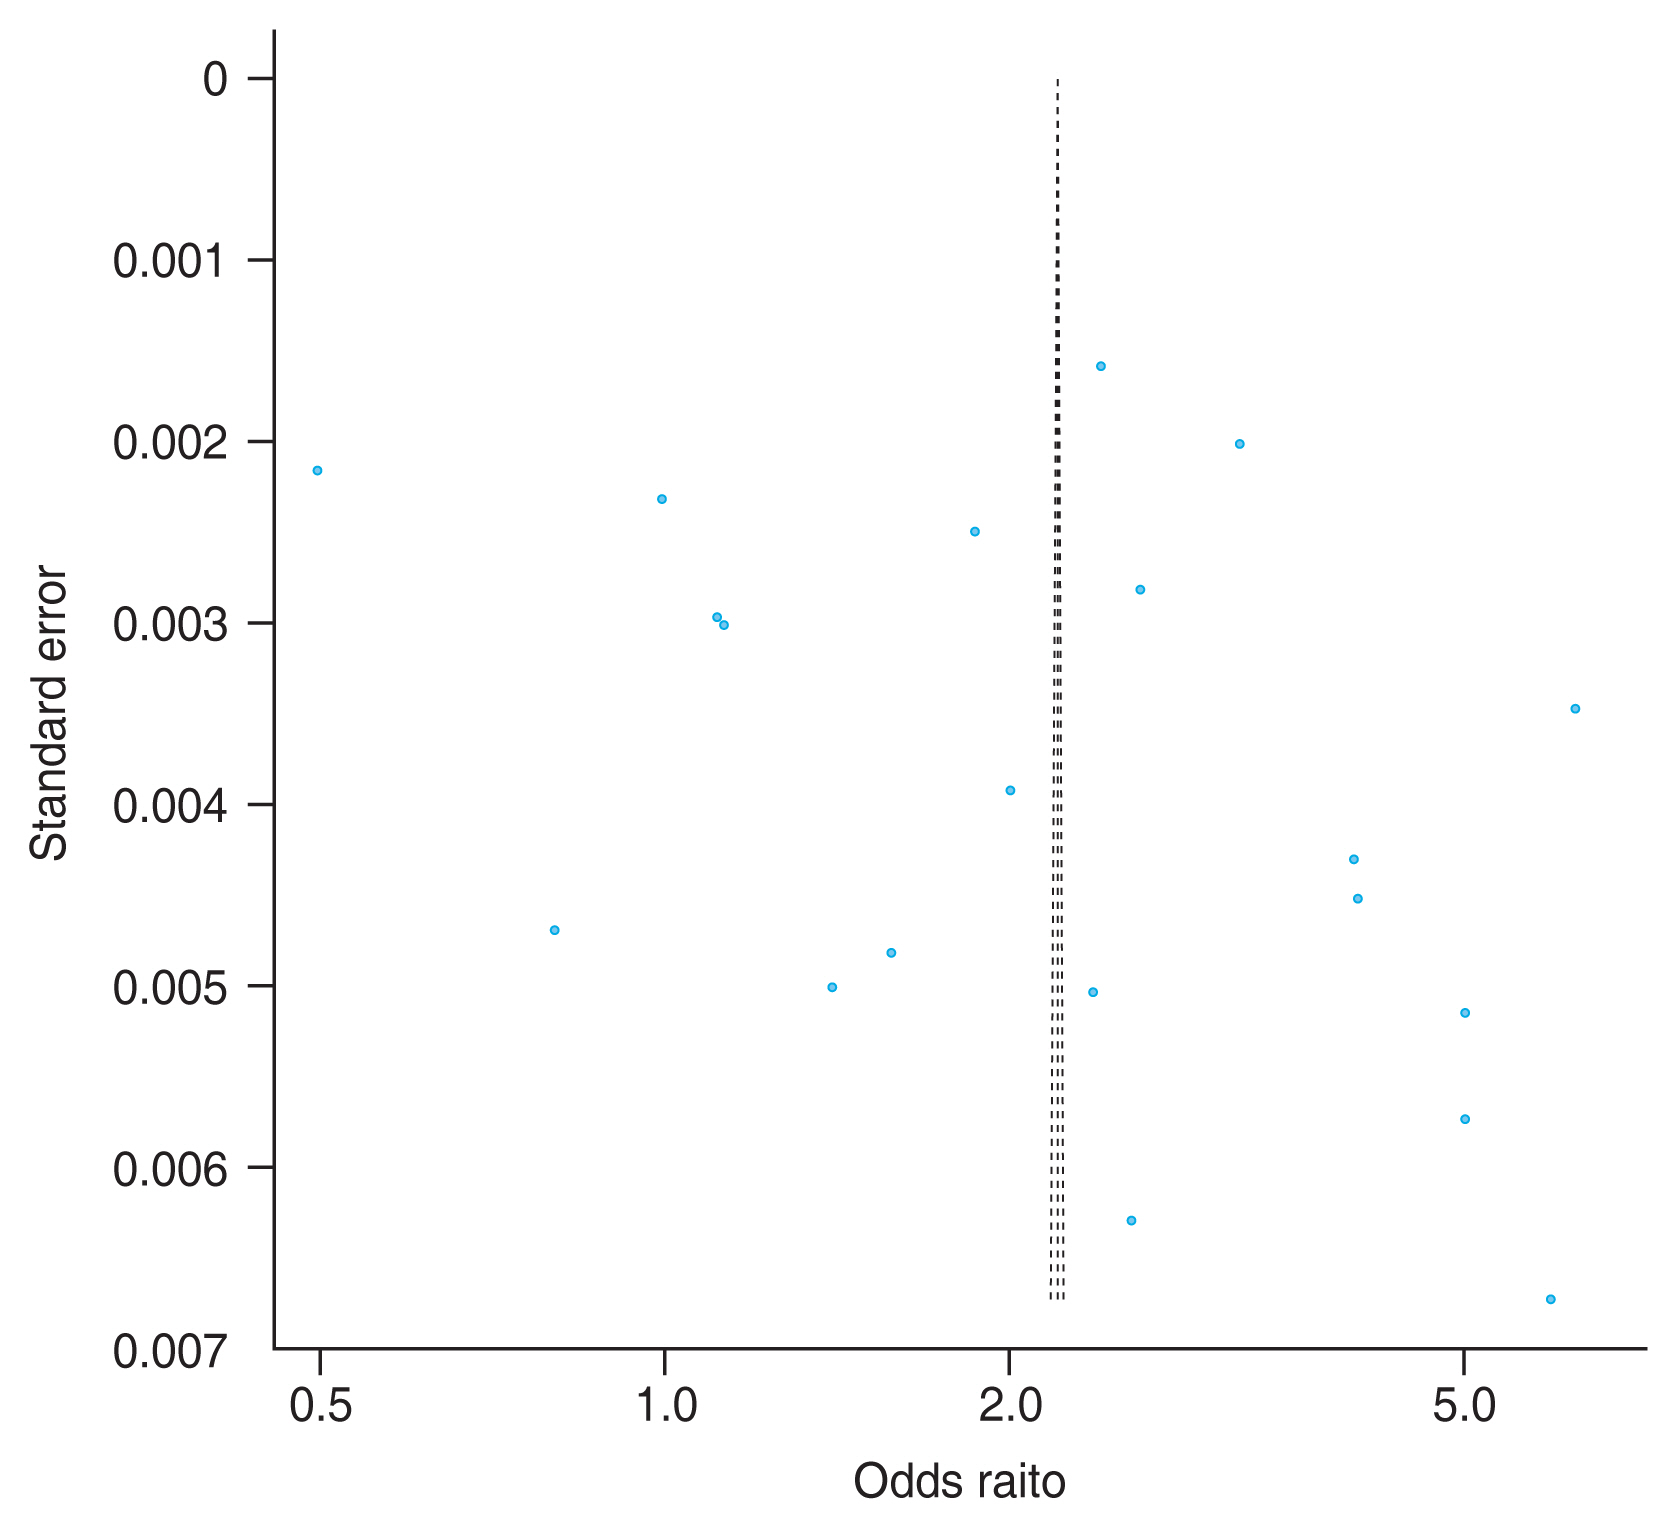
Funnel plots of publication bias regarding primary angle-closure glaucoma to primary open-angle glaucoma prevalence ratio. The middle-dotted line indicates the meta-analysis’s overall effect, while the two dotted lines on either side represent the 95% confidence intervals.
Discussion
Glaucoma is a leading cause of blindness worldwide, and its prevalence varies across different populations. Understanding the prevalence ratio of PACG and POAG in different populations is important for developing effective public health policies and interventions aimed at reducing the burden of glaucoma. Our study aimed to investigate the prevalence ratio of PACG and POAG in Asian population and to identify the factors that contribute to the variation in the prevalence ratio of these conditions across different populations.
Our study found that the pooled PACG to POAG prevalence ratio in Asian population was 2.204 (95% CI, 1.617– 3.004) with high heterogeneity, indicating that there is significant variation in the prevalence ratio of these conditions across different populations. We also conducted multiple meta-regression analyses to explore the factors that contribute to the variation in the prevalence ratio of PACG and POAG across different populations. Our analysis found that the prevalence of POAG is the most important predictor for heterogeneity, followed by continent and publication year. Specifically, for every additional elevation of POAG prevalence (i.e., increase of 1.0%), the PACG to POAG prevalence ratio is expected to rise by 0.471.
Our finding that the prevalence of POAG is the most important predictor for heterogeneity is consistent with previous studies [7,16,40,41]. For example, a study conducted in the United States [40] found that the prevalence of POAG was the most important predictor of the prevalence of glaucoma, followed by race/ethnicity and age. Another study conducted in Europe [7] found that the prevalence of POAG was the most important predictor of the prevalence of glaucoma, followed by age and sex. A study conducted in Japan [41] also found that the prevalence of POAG was the most important factor contributing to the variation in the prevalence of PACG and POAG. Additionally, a study conducted in China [16] found that the prevalence of POAG was the most important predictor for the prevalence of glaucoma.
Our multiple meta-regression analysis also found that continent is a significant predictor for heterogeneity. This finding is consistent with a previous study [2] that investigated the prevalence of glaucoma in different regions of the world. The study found that the prevalence of glaucoma varied significantly across different regions, with the highest prevalence in Africa and the lowest prevalence in Europe. The study suggested that the variation in the prevalence of glaucoma across different regions may be due to differences in genetic, environmental, and lifestyle factors.
Our study has several limitations that need to be considered. Firstly, the studies included in our meta-analysis were conducted in a variety of different populations with different ethnicities, cultures, and lifestyles, which may have contributed to the heterogeneity in our results. This could have affected the accuracy of our prevalence ratio estimates. Although we attempted to account for this heterogeneity by using a random-effects model, there may have been other unmeasured factors that contributed to the variation in our results. Additionally, the studies included in our meta-analysis were of varying quality, which may have influenced our results. We attempted to minimize the impact of this limitation by including only studies that met our inclusion criteria and by conducting sensitivity analyses to assess the robustness of our findings. Secondly, our meta-analysis focused only on the prevalence ratio of PACG and POAG in Asian population, and further research is needed to explore the prevalence ratio of these conditions in other populations. While our study provides important evidence of the prevalence ratio of PACG and POAG in Asian population, it is unclear whether our findings can be generalized to other populations. Therefore, further research is needed to explore the prevalence ratio of PACG and POAG in other populations and to identify the factors that contribute to the variation in the prevalence ratio of these conditions. Thirdly, our analysis did not account for potential confounding factors such as age, sex, and lifestyle factors, which may have affected the association between POAG and PACG. Although we attempted to account for differences in publication year and continent in our meta-regression analysis, other unmeasured factors may have confounded our results. Therefore, future studies should attempt to account for these potential confounding factors to better understand the association between POAG and PACG.
In conclusion, our study provides important evidence of the prevalence ratio of PACG and POAG in Asian population. We found that the prevalence of POAG is the most important predictor for heterogeneity, followed by continent and publication year. Our findings have important implications for the development of effective public health policies and interventions aimed at reducing the burden of glaucoma in Asian population. Further research is needed to explore the prevalence ratio of PACG and POAG in other populations and to identify the factors that contribute to the variation in the prevalence ratio of these conditions.
Acknowledgements
None.
Notes
Conflicts of Interest
None.
Funding
This study was supported by the National Research Foundation of Korea (NRF) grant (No. 1F1A1064186). The funder had no role in the initiation or design of the study, collection of samples, analysis, interpretation of data, paper writing or submission for publication. The study and researchers are independent of the funder.
Supplementary Materials
Supplementary Fig. 1. Flowchart for visualizing the study selection process of the systemic review.
kjo-2023-0057-Supplementary-Fig-1.pdfSupplementary materials are available from https://doi.org/10.3341/kjo.2023.0057.