Flow Void Analysis Using Different Thresholding Methods on a Choriocapillaris Optical Coherence Tomography Angiography Image Complemented with a Structural En Face Image
Article information
Abstract
Purpose
To investigate the flow characteristics using different thresholding methods on a choriocapillaris optical coherence tomography angiography (OCTA) image complemented with a structural en face image.
Methods
The 42 choriocapillaris OCTA images from healthy subjects were obtained with swept-source OCTA device and the 3 × 3-mm area OCTA images were processed with ImageJ. Using a raw choriocapillaris OCTA image and structural en face image, we adjusted the different structural signal intensity. Then, the raw images and adjusted images were binarized with a global threshold and an auto local threshold using the Phansalkar method at 1- or 2-intercapillary distance. Then, the mean area, number, and size of the flow void, were compared among the images using different thresholding methods.
Results
Mean flow void area, number, and size were different according to the different binarization method both in raw and adjusted images (all p < 0.001). The mean flow void area analyzed with global threshold method were well correlated with those with auto local threshold method both in raw and adjusted images (all intraclass correlations, >0.929).
Conclusions
Flow void features varied according to the different binarization methods but showed good correlation. The flow void characteristics according to the different binarization methods should be considered for the analysis of the choriocapillaris OCTA images complemented with a structural en face image.
The choriocapillaris is a vascular layer beneath the retinal pigment epithelium (RPE) and Bruch membrane, supplying blood and nutrients to the outer retina and RPE [1]. It has been suggested that the choriocapillaris may play a major role in the development or progression of various retinal diseases, including age-related macular degeneration, diabetic retinopathy, and central serous chorioretinopathy [2–4]. However, imaging the choriocapillaris has been challenging due to the limited resolution of available imaging modalities [1].
Optical coherence tomography angiography (OCTA) is a noninvasive and safe imaging technology with an axial resolution of 5 to 7 μm and a transverse resolution of 14 to 20 μm [5]. It provides vascular information with depth-resolved images [1,6,7]. However, imaging the choriocapillaris remains challenging due to its unique characteristics. The choriocapillaris is a thin vascular layer composed of vessels slightly larger than typical capillaries, and it is located tightly in the inner choroid with a lobular appearance. These features make it difficult to capture the choriocapillaris clearly using OCTA [1,7,8].
The investigation of the choriocapillaris status using OCTA has primarily relied on flow void analysis rather than identifying each individual choriocapillaris structure [9,10]. However, the results obtained from flow void analysis can vary depending on the image processing and threshold methods used [11–15]. To address this issue, a new imaging processing method has been suggested, involving the use of a structural en face image to adjust the signal strength of each lesion in the choriocapillaris images [11]. This approach aims to improve the accuracy and reliability of assessing the choriocapillaris and its abnormalities using OCTA. However, the relationship between different image processing methods before and after the adjustment of the structural information has not been reported. Therefore, in this study, we aimed to investigate the differences and relationships of the flow voids based on different thresholding methods and the adjustment of structural signal intensity using choriocapillaris OCTA images. This analysis will help us better understand how these processing techniques affect the assessment of choriocapillaris status and provide insights into improving the reliability of OCTA in evaluating choriocapillaris abnormalities.
Materials and Methods
Ethics statement
This is a retrospective analysis of data from a prospective study conducted with the approval of the Institutional Review Board of Korea University Medical Center (No. 2016AN0344), following the principles of the Declaration of Helsinki. The OCTA images were acquired from the healthy subjects with an informed consent.
Study design
Using the swept-source OCTA ( Plex-Elite ver. 1.6.0.21130, Carl Zeiss Meditec Inc) with a wavelength of 1,040 to 1,060 nm and a speed of 100,000 A-scans/sec, OCTA scans with a 3 × 3 mm are centered at the fovea were acquired. The investigator checked the quality of the image and artifact and repeated the exam until proper images without artifacts were acquired. IOLMaster 500 ver. 7.3.0.0048 (Carl Zeiss Meditec AG) was used to measure the axial length.
Analysis of the choriocapillaris OCTA images
The choriocapillaris OCTA images with a slab boundary of 29 to 49 μm below the RPE and its structural en face images were exported. The images were processed with ImageJ ver. 1.51 (US National Institutes of Health). The OCTA images were converted to 8-bit and the gray scale values of each pixel were used to determine the mean and standard deviation of all images [16]. Then, the threshold for the binarization with a global threshold was defined as vascular density lower than two standard deviations from the mean of the 42 images and all images were binarized [16]. For the binarization with an auto local threshold using the Phansalkar method, the images were processed with a radius of 1-intercapillary distance (1-ICD; 4 μm) and 2-ICD (8 μm) [16]. After the binarization, the mean flow void area, number, and size were analyzed. The mean flow void area was defined as follow: flow void area (%) = sum of the pixels of the flow void area / pixels of the total area. The mean flow void size was defined as follow: the mean flow void area (μm2) / total number of the flow void. Flow void areas are defined based on a criterion of 50 pixels (the area of a circle with an ICD as the radius) and those with 50 or fewer pixels are categorized as small flow void areas, while those exceeding 50 pixels are classified as large flow void areas [16].
For the compensation of regional signal differences, structural choriocapillaris en face image was applied to the choriocapillaris OCTA images. After the conversion to 8 bit, the structural en face image inverted and Gaussian smoothing filter (radius 3) was applied. Then, the choriocapillaris OCTA images and the smoothed, inverted structural en face image were multiplied and merged using the image calculator function. Then, the structural signal adjusted images were also used for the flow void analysis.
Statistical analysis
Normal distribution of the parameters was performed with Kolmogorov-Smirnov tests. General linear model was used to compare the parameters and intraclass correlations were used for the assessment of the agreement. Statistical analysis was performed with IBM SPSS ver. 20.0 (IBM Corp). A p-value of <0.05 was considered statistically significant.
Results
This study included 42 eyes from 21 healthy volunteers with mean age of 33.81 ± 3.90 years. Eleven patients were male, and the mean axial length was 25.46 ± 1.01 mm. The mean grayscale of the raw image and adjusted image were 101.66 ± 3.51 and 128.96 ± 13.49, respectively (p < 0.001).
In raw image analyses, the mean flow void area processed with the methods of global threshold and auto local threshold using the Phansalkar method at 1- and 2-ICD were 3.26% ± 1.79%, 3.30% ± 1.70%, and 7.37% ± 2.58%, respectively (p < 0.001). The mean flow void area with a global threshold method and auto local threshold using the Phansalkar method at 1-ICD were lower than that of auto local threshold using the Phansalkar method at 2-ICD (Table 1). In adjusted image analyses, the mean flow void area processed with the methods of global threshold and auto local threshold using the Phansalkar method at 1- and 2-ICD were 3.60% ± 3.12%, 7.64% ± 3.42%, and 14.47% ± 3.82%, respectively ( p < 0.001). The mean flow void area with a global method was lower than those of auto local threshold using the Phansalkar method at 1- and 2-ICD (Table 1). The flow void area processed by the global threshold were similar between raw image and adjusted image ( p = 0.418), while the mean flow void area processed with the auto local threshold using the Phansalkar method at 1- and 2-ICD in adjusted images were greater than those of raw images (both p < 0.001). Intraclass correlations for different adjustment methods of the raw image and adjusted image ranged from 0.929 to 0.975 and 0.957 to 0.984, respectively (Table 2). Intraclass coefficients for different images and adjustment methods used to quantify the flow void area ranged from 0.605 to 0.825 (Table 3).
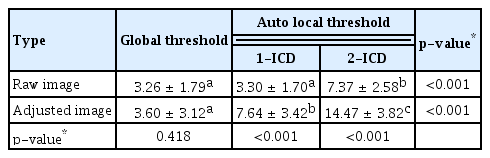
Descriptive statistics for the mean flow void area in a 3 × 3-mm region using various image types and different binarization methods
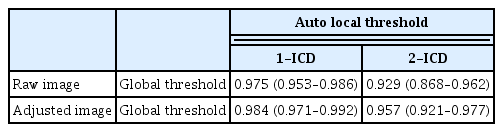
Intraclass coefficients (95% confidence interval) for various adjustment methods used to quantify the flow void area of the choriocapillaris
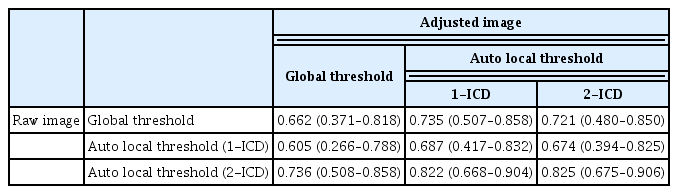
Intraclass coefficients (95% confidence interval) for various images and adjustment methods used to quantify the flow void area of the choriocapillaris
The mean number and size of flow void area of the raw image were 1,618.29 ± 532.11 and 155.99 ± 47.14 μm2 from the global threshold; 3,739.76 ± 610.84 and 116.20 ± 31.53 μm2 from the auto local threshold using the Phansalkar method at 1-ICD; and 4,620.12 ± 321.18 and 200.34 ± 48.80 μm2 from the auto local threshold using the Phansalkar method at 2-ICD; and those were statistically different among the method with the process (all p < 0.001). The mean number and size of flow void area of the adjusted image were 1,239.79 ± 547.15 and 231.68 ± 88.71 μm2 from the global threshold; 3,579.62 ± 673.81 and 177.79 ± 53.99 μm2 from the auto local threshold using the Phansalkar method at 1-ICD; and 4,330.83 ± 280.45 and 296.22 ± 81.32 μm2 from the auto local threshold using the Phansalkar method at 2-ICD; and those were statistically different among the method with the process (all p < 0.001) (Tables 4, 5). When analyzed based on the flow void size, the mean number of small flow void areas (≤50 pixels) was smaller in the adjusted image for global threshold and auto local thresholds using the Phansalkar method at both 1- and 2-ICD compared to the raw image (all p < 0.001) (Table 6). The results of the analysis for large flow void areas showed that, excluding the cases of auto local threshold using the Phansalkar method at 2-ICD, the adjusted image showed a mean number of flow void areas larger than the raw image for both global threshold ( p = 0.012) and auto local threshold using the Phansalkar method at 1-ICD ( p < 0.001). Representative cases are presented in Fig. 1A–1H.
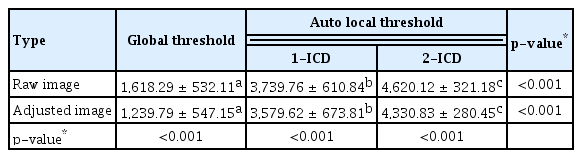
Descriptive statistics for the mean number of flow void areas in a 3 × 3-mm region using various image types and different binarization methods
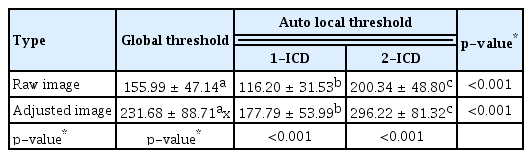
Descriptive statistics for the mean size of flow void areas (μm2) in a 3 × 3-mm region using various image types and different binarization methods
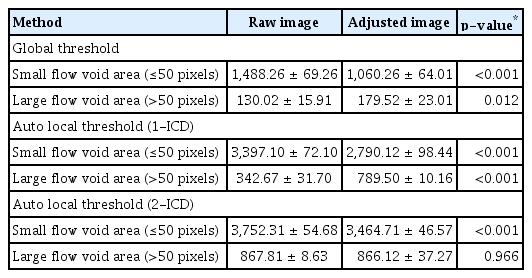
Descriptive statistics for the mean number of small flow void areas according to the size in a 3 × 3-mm region using various image types and different binarization methods
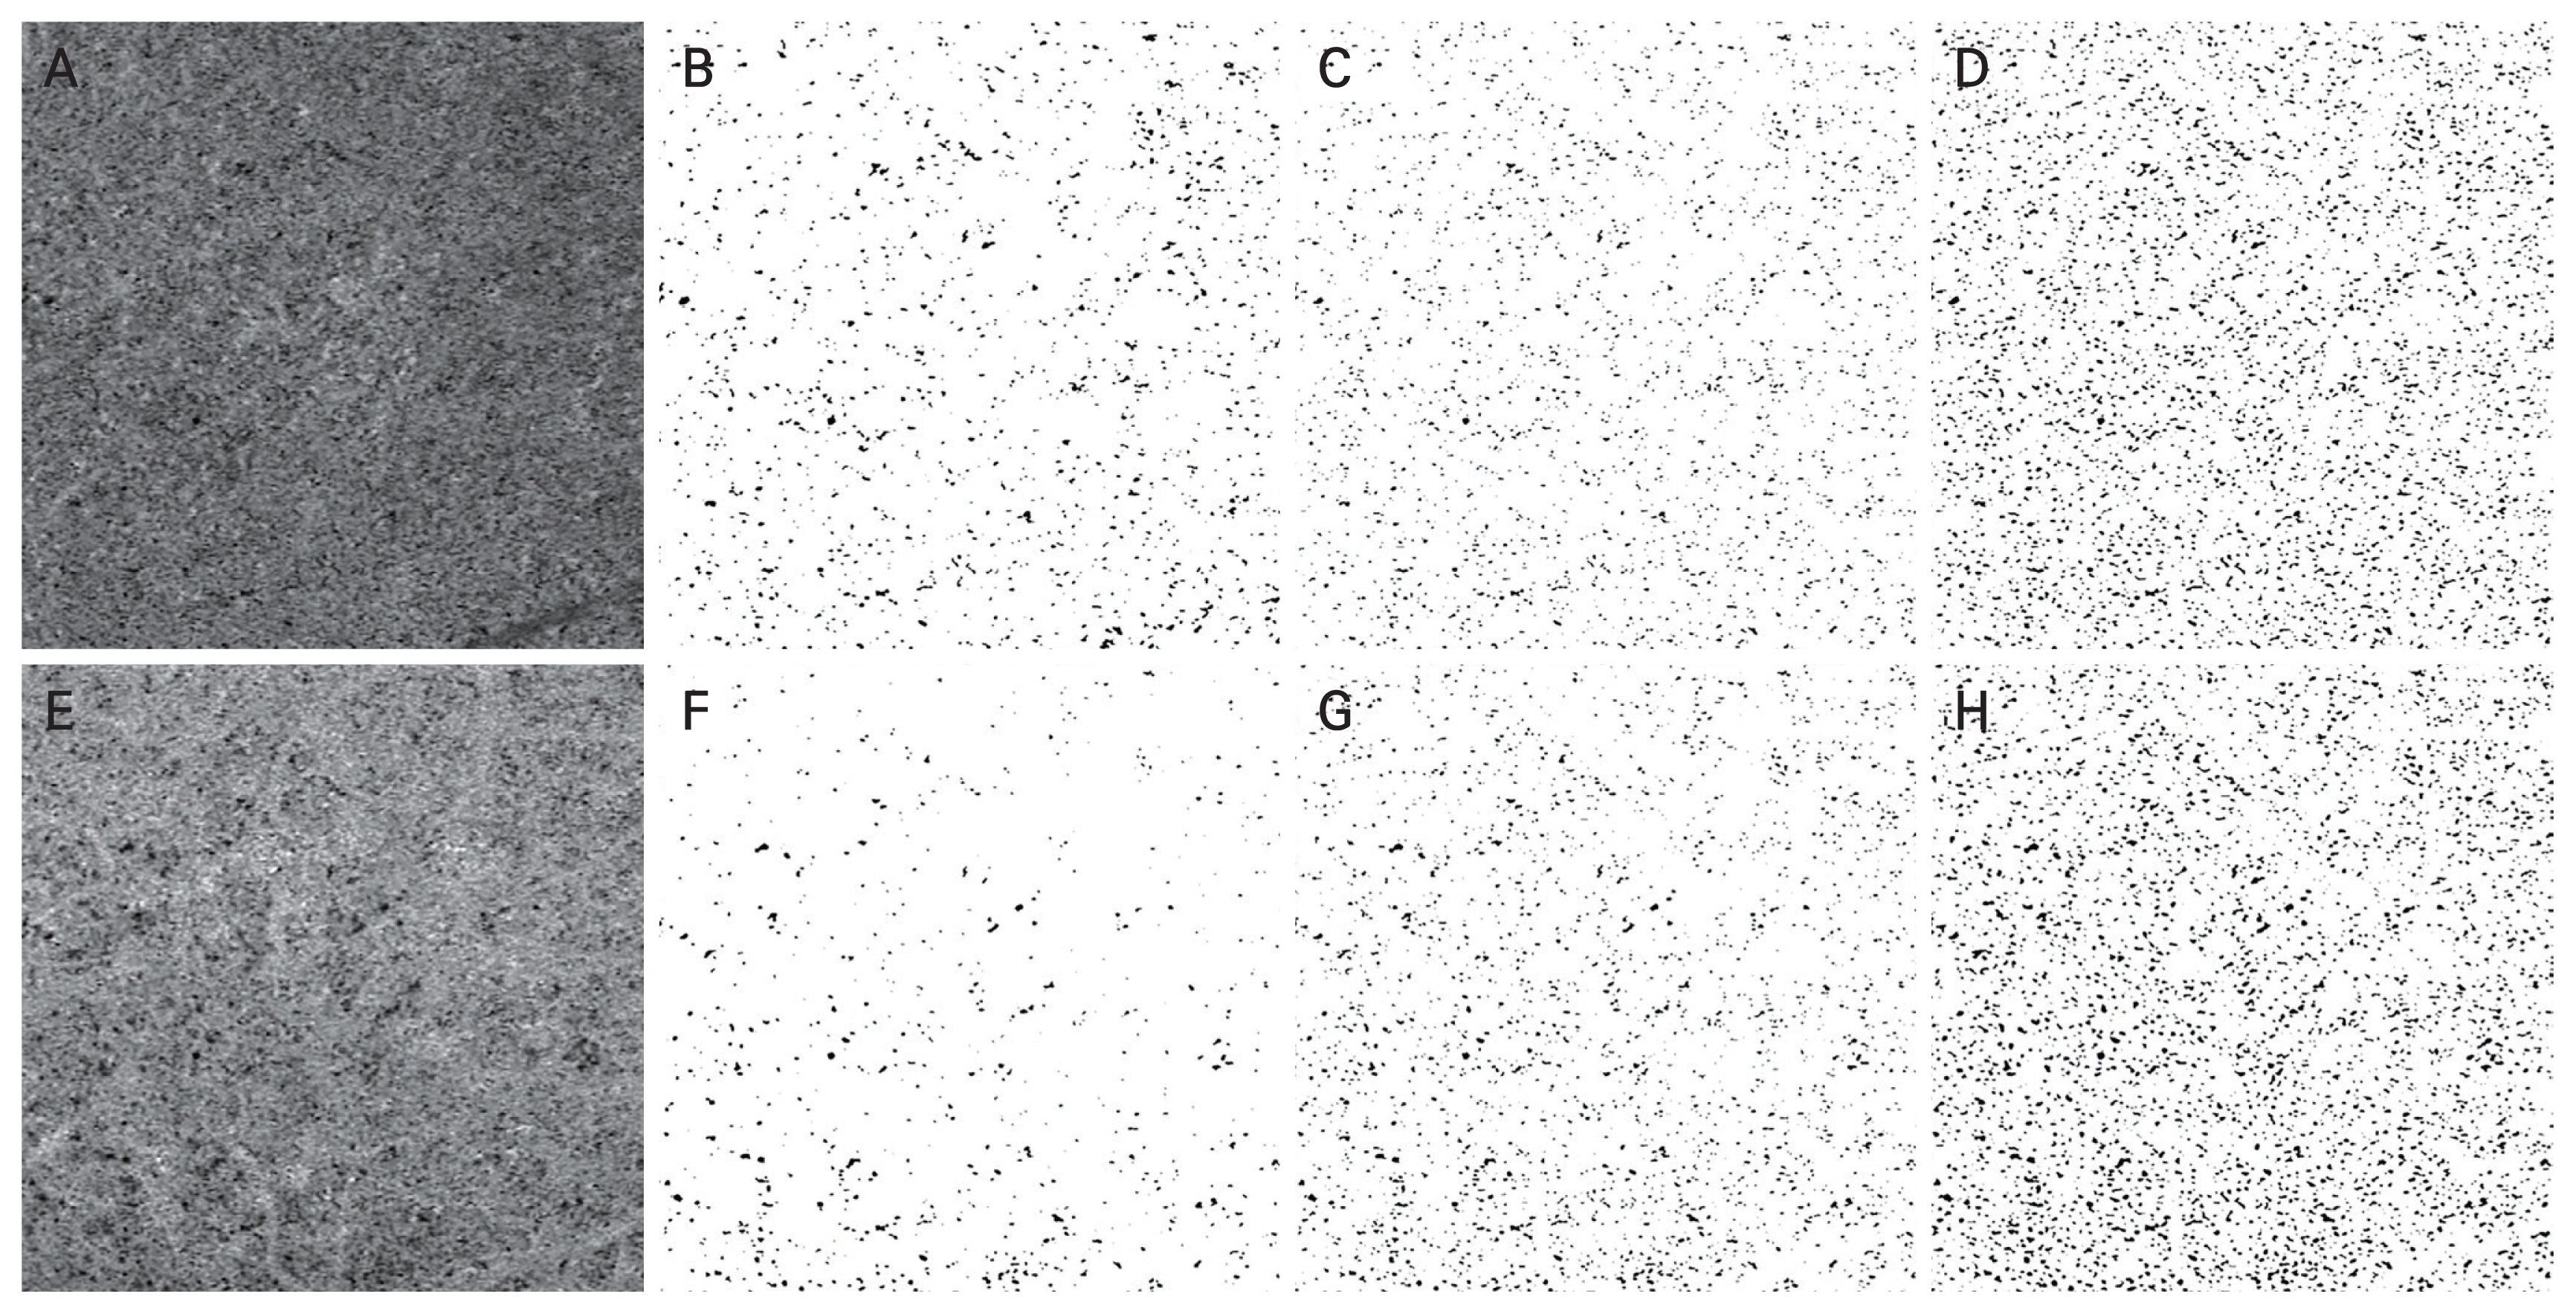
Binarization of choriocapillaris images using various thresholding methods. (A) Raw choriocapillaris flow image. Binarized images processed with (B) a global threshold, (C) auto local threshold using the Phansalkar method at 1-intercapillary distance, and (D) auto local threshold using the Phansalkar method at 2-intercapillary distance. (E) Structural en face adjusted choriocapillaris flow image. Binarized images processed with (F) a global threshold, (G) auto local threshold using the Phansalkar method at 1-intercapillary distance, and (H) auto local threshold using the Phansalkar method at 2-intercapillary distance.
Discussion
In this study, we aimed to investigate the flow void characteristics of the choriocapillaris using OCTA images, specifically examining the differences based on various image processing methods. Recently, both global threshold and auto local threshold methods have been proposed for calculating flow void areas in choriocapillaris microvasculature analysis [5,12–14,16]. Additionally, there has been a suggestion to incorporate local structural changes using en face images to complement the analysis, taking into account structural signal variations [11]. Using these various methods, flow void characteristics were analyzed in healthy individuals, and this study confirmed that while flow void characteristics may vary depending on the binarization method used, but there is a high correlation among the values processed with different image processing methods.
The analysis of choriocapillaris OCTA images differs from the analysis of retinal vasculature, as it focuses on the assessment of empty flow void areas rather than vascular density due to various reasons [9,10]. Subsequently, several studies and their outcomes have been reported regarding methods for analyzing flow void areas in the choriocapillaris [1,5,7,9–17]. Analyzing flow voids involves the binarization of choriocapillaris images into white and black regions. In this process, two main methods are commonly used: the global threshold method, where a threshold is determined based on the average and standard deviation of the image, usually when these values are known, and the auto local threshold method, which is employed when obtaining these values is challenging, using the threshold of specific regions within the image itself [5,12,14,16]. Among the auto local threshold methods, the Phansalkar method, which is reported to be more favorable for distinguishing black areas, is predominantly used [5,12,14,16]. These methods are the basis for reporting flow void areas in choriocapillaris of normal individuals in various studies, with reported normal average flow void areas ranging from 2.80% to 9.20% [12,17]. In this current study, depending on the image processing approach, the mean flow void area ranged from 3.26% to 14.47%. When applying global threshold or auto local threshold with 1- or 2-ICD to the raw image, and global threshold or auto local threshold with 1-ICD to the adjusted image, the results fell approximately within the range of previous research findings. However, when applying the auto local threshold method with 2-ICD to the adjusted image, the results were notably higher than those from previously known methods.
The tendency for the mean flow void area to be higher in the adjusted image processed with auto local threshold, as observed in the results of this study, appears to be primarily due to the increase in the average flow void area size. This trend is likely attributed to the characteristics of the Phansalkar method [12,14,16,18,19]. As conventionally known, the brightness of choriocapillaris images can influence the binarization process, and in this study, it was observed that the gray scale values in the adjusted images were higher than those in the raw images [19]. The overall increase in gray scale values with the adjustment of structural en face images likely impacted the image processing of auto local threshold with the Phansalkar method, which relies on setting local thresholds [12,14,16,18,19]. In the adjusted images, areas that appeared as flow voids in the raw images but structurally had lower local values could have their gray scale values elevated through signal enhancement. Consequently, the average gray scale value within the designated radius, whether 1- or 2-ICD, increased. This led to areas that were previously not considered flow voids near the real flow void area in the raw images being classified as such in the adjusted images due to surpassing the threshold values. As a result, the mean flow void area increased overall. Based on these observations, we hypothesized that this contributed to the overall increase in the mean flow void area. Furthermore, this study observed that flow voids with a small size, whether the global threshold method or the auto local threshold method was applied, exhibited a lower mean count in adjusted images compared to raw images. This may suggest that the application of structural en face imaging can potentially reduce the number of small flow voids arising from structural anomalies, resulting in a despeckling effect [11–13,16].
In this study, the mean flow void area varied depending on the image processing methods. While there may be differences between the values calculated using traditional methods that rely on the group’s average and standard deviation for flow void area and those calculated using different image processing methods, it is generally known that they exhibit a high degree of correlation [5,12,14,16]. In this study as well, a strong correlation was found among the results depending on the image processing method employed. Whether the same image was processed using a global threshold or an auto local threshold, the intraclass coefficient consistently exceeded 0.9, regardless of whether structural en face imaging was applied. Furthermore, when comparing the correlations between the different images, they generally exhibited results exceeding 0.6. This aligns with the trends seen in several previously published studies.
This study has several limitations. First, the number of cases registered in the study is small. Second, since the study recruited relatively young subjects without significant retinal diseases, the results of this study may not be directly applicable to patients with other age or retinal disorders. Third, as this study did not involve multiple measurements on the same individual, assessing interexaminer reliability was not possible. Fourth, because this study compared only the patterns based on different thresholding methods, and due to the lack of a standard method for choriocapillaris analysis, it is limited in proposing the most ideal approach for analysis. Furthermore, since the current choriocapillaris imaging methods are not practically applicable in clinical settings, the results of these studies may serve as references for future research but may have limited clinical significance. Fifth, analyzing the differences between examination methods requires assessing both inter-visit variability and interexaminer variability. However, due to issues with the conditions under which the research is conducted, we were unable to collect data at the initial stages, and as a result, we couldn’t conduct an analysis regarding this matter.
In conclusion, the analysis of choriocapillaris OCTA images in healthy individuals resulted in variations in the flow void area depending on the image processing method. After applying a structural en face image to adjust the structural signals, a significant difference was observed when using the auto local threshold method for binarization between the raw and adjusted images. However, there was a high correlation between these values. When analyzing choriocapillaris OCTA images, it is important to be aware of the potential differences that can arise based on these image analysis methods and to choose the appropriate method depending on the situation.
Acknowledgements
None.
Notes
Conflicts of Interest
None.
Funding
None.