Diagnosing Polypoidal Choroidal Vasculopathy Using Color Fundus Photography, Optical Coherence Tomography, and Optical Coherence Tomography Angiography
Article information
Abstract
Purpose
To compare the diagnostic accuracy of differentiating polypoidal choroidal vasculopathy (PCV) from exudative age-related macular degeneration (AMD), using color fundus photography (CFP), optical coherence tomography (OCT), and swept-source OCT angiography (SS-OCTA) without using indocyanine green angiography (ICGA).
Methods
Treatment-naive eyes with exudative AMD that underwent CFP, OCT, SS-OCTA, and ICGA imaging before treatment were identified. Images of each patient were categorized into two sets (set A, CFP + OCT; set B, CFP + SS-OCTA). In set B, both the en face and cross-sectional B scans were analyzed. Each set was reviewed by two graders, and it was determined whether the presumed diagnosis was PCV. Sensitivity, specificity, and area under the receiver operating characteristic curve (AUC) for the diagnosis of PCV were assessed for each set by comparing diagnoses that included ICGA. The number of polypoidal lesions in each set was calculated and compared to ICGA.
Results
A total of 94 eyes from 94 patients with AMD were included in the study, of which 66.0% were male, and the mean age was 71.8 ± 9.0 years. The PCV diagnosis rate using ICGA was 45.7%. The sensitivity was 0.88 for set A and 0.93 for set B, while the specificity was 0.94 for set A and 0.96 for set B. The AUC was 0.90 (95% confidence interval [CI], 0.83–0.97) for set A and 0.96 (95% CI, 0.90–1.00) for set B. Set A detected 1.28 ± 0.91 polypoidal lesions, while set B detected 1.47 ± 1.01; ICGA showed 1.51 ± 0.86.
Conclusions
This study highlights that, without using ICGA, both CFP combined with OCT and CFP combined with SS-OCTA demonstrate high sensitivity, specificity, and AUC in diagnosing PCV. It is evident that SS-OCTA contributes to enhancing sensitivity, specificity, and AUC for PCV diagnosis.
Polypoidal choroidal vasculopathy (PCV) is a subtype of exudative age-related macular degeneration (AMD). PCV subtype is about 50% of neovascular AMD cases in Asia, whereas this portion is 10% to 20% in the White population [1,2]. Anti–vascular endothelial growth factor (anti-VEGF) therapy has been effective in PCV [3]. However, compared to outcomes of treatment of other neovascular AMD, eyes with the PCV variant were observed to be poor responders to anti-VEGF therapy [4,5]. For these reasons, it is necessary to differentiate clinically between PCV and typical AMD.
The gold standard of diagnosing PCV is indocyanine green angiography (ICGA) which is characterized by nodular dilatations arising from neovascular networks that branching out mainly in the subretinal pigment epithelial space [6]. Since ICGA is time-consuming and invasive, researches have been conducted to replace it. Optical coherence tomography (OCT) images are useful in diagnosing PCV when used alone or in combination with other images. Several OCT features such as sharp-peaked pigment epithelial detachment (PED), double-layer sign, and en face OCT has been helpful for diagnosing PCV and polypoidal lesions [7–9]. In a previous study, using color fundus photography (CFP), OCT, and fluorescein angiography (FA) without ICGA, it is possible to diagnose PCV with a sensitivity and specificity of 95% [10].
Recently, swept-source OCT angiography (SS-OCTA) image is comparable to ICGA for the diagnosis of treatment-naive PCV and it may provide enhanced identification of both polypoidal lesions and branched vascular network (BVN) in treatment-naive PCV than ICGA. Unlike OCT, SS-OCTA might be useful for diagnosing PCV because it shows the blood flow on cross-sectional B-scan images and the vascular structure of BVN on en face images [11]. However, the previous study did not report definitive sensitivity and specificity values for diagnosing PCV using multimodal imaging without ICGA. Moreover, other studies that have assessed polypoidal lesions using OCTA have reported varying detection rates ranging from 17% to 92% [11–14]. Therefore, this study aims to identify sensitivity, specificity, predictive accuracy (area under the receiver operating characteristic curve, AUC) and the detection of polypoidal lesions using CFP, OCT, and SS-OCTA without using ICGA.
Materials and Methods
Ethics statement
This study was approved by the Institutional Review Board of Kyung Hee University Hospital (No. 2023-08-001). The requirement for informed consent was waived due to the retrospective nature of the study.
Study design and setting
Patients who visited Kyung Hee University Hospital (Seoul, Korea) from March 1, 2017, to Feburary 30, 2021, with treatment-naive exudative AMD including PCV in one or both eyes and underwent four ophthalmologic examinations (CFP, OCT, SS-OCTA, FA or ICGA) were included in this study. Patient with high myopia (−6.0 diopters or greater, axial length of 26.0 mm or greater), severe media opacity which could not analyze images, or the presence of other retinal vascular disorders (e.g., macroaneurysm, diabetic retinopathy, and retinal vascular occlusion) were excluded. When exudative AMD was diagnosed in both eyes, only the right eye was included. In this study, images and clinical data from 94 eyes from 94 patients with AMD were independently analyzed by two retina specialists. During the analysis, the patients were assessed using two different diagnosing sets. Excluding the use of ICGA, the first set used CFP and OCT images, while the second set used CFP and SS-OCTA images. During the analysis, any disagreement in diagnosis between two retina specialists was reviewed and discussed and consensus was reached with involvement of a senior adjudicator. In this way, we assessed the diagnostic accuracy of PCV among the 94 eyes in the two sets, excluding ICGA. Statistical analysis was then conducted to compare these two groups with the PCV diagnoses made by ICGA.
Diagnostic criteria of PCV and image analysis
Each patient has undergone CFP, OCT, SS-OCTA and FA or ICGA at initial visit. CFP images (Visucam 524 or Clarus 500, Carl Zeiss Meditec Inc) were reviewed for features of extensive subretinal hemorrhage (subretinal and subretinal pigment epithelium [sub-RPE] hemorrhage larger than 4 disc diameter) and orange nodule (which shows one or more orange subretinal round elevation) [6,15].
ICGA images (Spectralis, Heidelberg Engineering) were analyzed by EVEREST criteria [16]. PCV was diagnosed by focal hyperfluorescent lesions appearing before 6 minutes on ICGA plus at least one of the followings: BVN on ICGA, pulsatility on dynamic ICGA, nodular appearance when ICGA viewed steroscopically, hypofluorescent halo on ICGA, orange subretinal nodule on CFP, or associated with massive submacular hemorrhage [16,17].
OCT images (Spectralis, Heidelberg Engineering) were analyzed for the following features: sharp-peaked PED, sub-RPE ring-like lesion, complex or multilobular PED, double-layer sign (undulating RPE line that is separated from Bruch membrane line underneath), thick choroid with dilated Haller layer vessels, predominant subretinal fluid with or without intraretinal fluid, en face OCT complex RPE elevation [6]. The combination of three OCT-based major criteria (sharp-peaked PED, sub-RPE ring-like lesion, en face OCT complex RPE elevation) were assessed to diagnose PCV (Fig. 1A–1C). Detailed OCT criteria of polypoidal lesion were defined according to the recent definition proposed by the Asia-Pacific Ocular Imaging Society PCV Workgroup [6].

Reference images of optical coherence tomography (OCT) features in diagnostic criteria. (A) Sharp-peaked pigment epithelial detachment (arrow), based on cross-sectional OCT. (B) Subretinal pigment epithelium ring-like lesion, based on cross-sectional OCT. (C) Complex retinal pigment epithelium elevation, based on en face OCT.
SS-OCTA images (PLEX Elite 9000, Carl Zeiss Meditec Inc) were analyzed both the en face and cross-sectional B scans with blood flow images to identify polypoidal lesions using 6 × 6 mm images. The en face slabs were initially automatically created using boundary layers from the RPE to the RPE-fit. RPE-fit layer is corresponded with the Bruch membrane. These boundary layers were established using the custom segmentation feature and the exact position and thickness of the slab were then manually adjusted to optimize the signal for viewing of the PCV complex. Polypoidal lesions were analzyed by viewing both the en face slabs and cross-sectional B scans. En face slabs with hyperreflective foci with blood flow signals on cross-sectional B scans were calculated as polypoidal lesions. PCV were diagnosed by at least one polypoidal lesions and combination of dome-shaped, sharp-peaked PEDs and sub-RPE ring-like lesion on the cross-sectional B scans (Fig. 2A–2C) [11,18].

Reference images of swept-source optical coherence tomography (SS-OCTA) features in diagnostic criteria. (A) Early phase indocyanine green angiography image of focal hyperfluorescent lesions. (B) En face SS-OCTA image showing hyperreflective foci in polypoidal lesions. (C) Cross-sectional B-scan image shows subretinal pigment epithelium ring-like lesion with green blood flow signals.
Set analysis and image reading
In this study, it was assessed by dividing into two sets, A and B. In set A, patients were diagnosed PCV by analyzing CFP and OCT. In set B, CFP and SS-OCTA with en face and cross-sectional B scans were analyzed. After analyzing, each set was compared with PCV diagnosed by ICGA. Then, sensitivity, specificity, positive predictive value (PPV), negative predictive value (NPV), and AUC were analyzed. Number of polypoidal lesion which can be anatomical marker of PCV were analyzed in each set.
Statistical analysis
Statistical analysis of sensitivity, specificity, PPV, NPV, AUC were analyzed. Cronbach α and interclass correlation coefficient (ICC) were analyzed to evaluate correlation between polypoidal lesions in set A, set B, and ICGA, using single measure, two-way random model. All statistical analysis was performed with IBM SPSS ver. 24.0 (IBM Corp).
Results
The mean age was 71.8 ± 9.0 years, with 62 (66.0%) being male. At baseline, 43 eyes (45.7%) were diagnosed with PCV, 29 (30.9%) with type 1 choroidal neovascularization (CNV), 17 (18.1%) with type 2 CNV, and 5 (5.3%) with type 3 CNV, (Table 1). In set A and set B, 40 eyes and 41 eyes were diagnosed with PCV, respectively. However, three eyes in set A and two eyes in set B were not diagnosed with PCV on ICGA.

Demographic and clinical characteristics of patients (n = 94)
Based on this result, set A (CFP + OCT) showed a sensitivity of 0.88, specificity of 0.94, PPV of 0.93, NPV of 0.91, and AUC of 0.90 (95% confidence interval [CI], 0.83–0.97). Set B (CFP + SS-OCTA) had a sensitivity of 0.93, specificity of 0.96, PPV of 0.95, NPV of 0.94, and AUC of 0.96 (95% CI, 0.90–1.00) (Table 2 and Fig. 3). Between two image sets, set B showed better results including higher sensitivity, specificity, PPV, NPV, and AUC. An AUC of 0.8 or greater indicates high prediction accuracy, while an AUC of less than 0.8 indicates relatively low accuracy. Therefore, both sets showed high prediction accuracy but set B has higher AUC than set A.
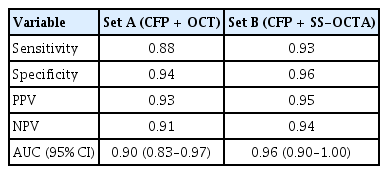
Sensitivity, specificity, PPV, NPV, and AUC of image set A and set B (n = 94)

The receiver operating characteristic curve of set A (color fundus photography + optical coherence tomography) and set B (color fundus photography + swept-source optical coherence tomography angiography). The area under the receiver operating characteristic curve (AUC) was 0.90 (95% confidence interval [CI], 0.83–0.97) in set A and 0.96 (95% CI, 0.90–1.00) in set B.
In PCV diagnosed eye, the number of polypoidal lesions were calculated at each set. Set A detected 1.28 ± 0.91 polypoidal lesions, while set B detected 1.47 ± 1.01 and ICGA showed 1.51 ± 0.86. The scatter plots comparing the number of polypoidal lesions in set A, set B, and ICGA in each patient was analyzed (Fig. 4A, 4B). In ICC analysis, Cronbach α shows 0.86 between set A and ICGA. In set B and ICGA, Cronbach α was 0.91. In single measure analysis using two-way random model, which showed how much difference is between two groups, showed ICC of 0.76 (95% CI, 0.60–0.86; p < 0.001) between set A and ICGA, and ICC of 0.84 (95% CI, 0.72–0.91; p < 0.001) between set B and ICGA. This showed both set A and set B are correlated to ICGA diagnosed group. Set B, which includes SS-OCTA images, shows a stronger correlation in the analysis of the number of polypoidal lesions compared to set A, and it is comparable to ICGA like previous study [11].
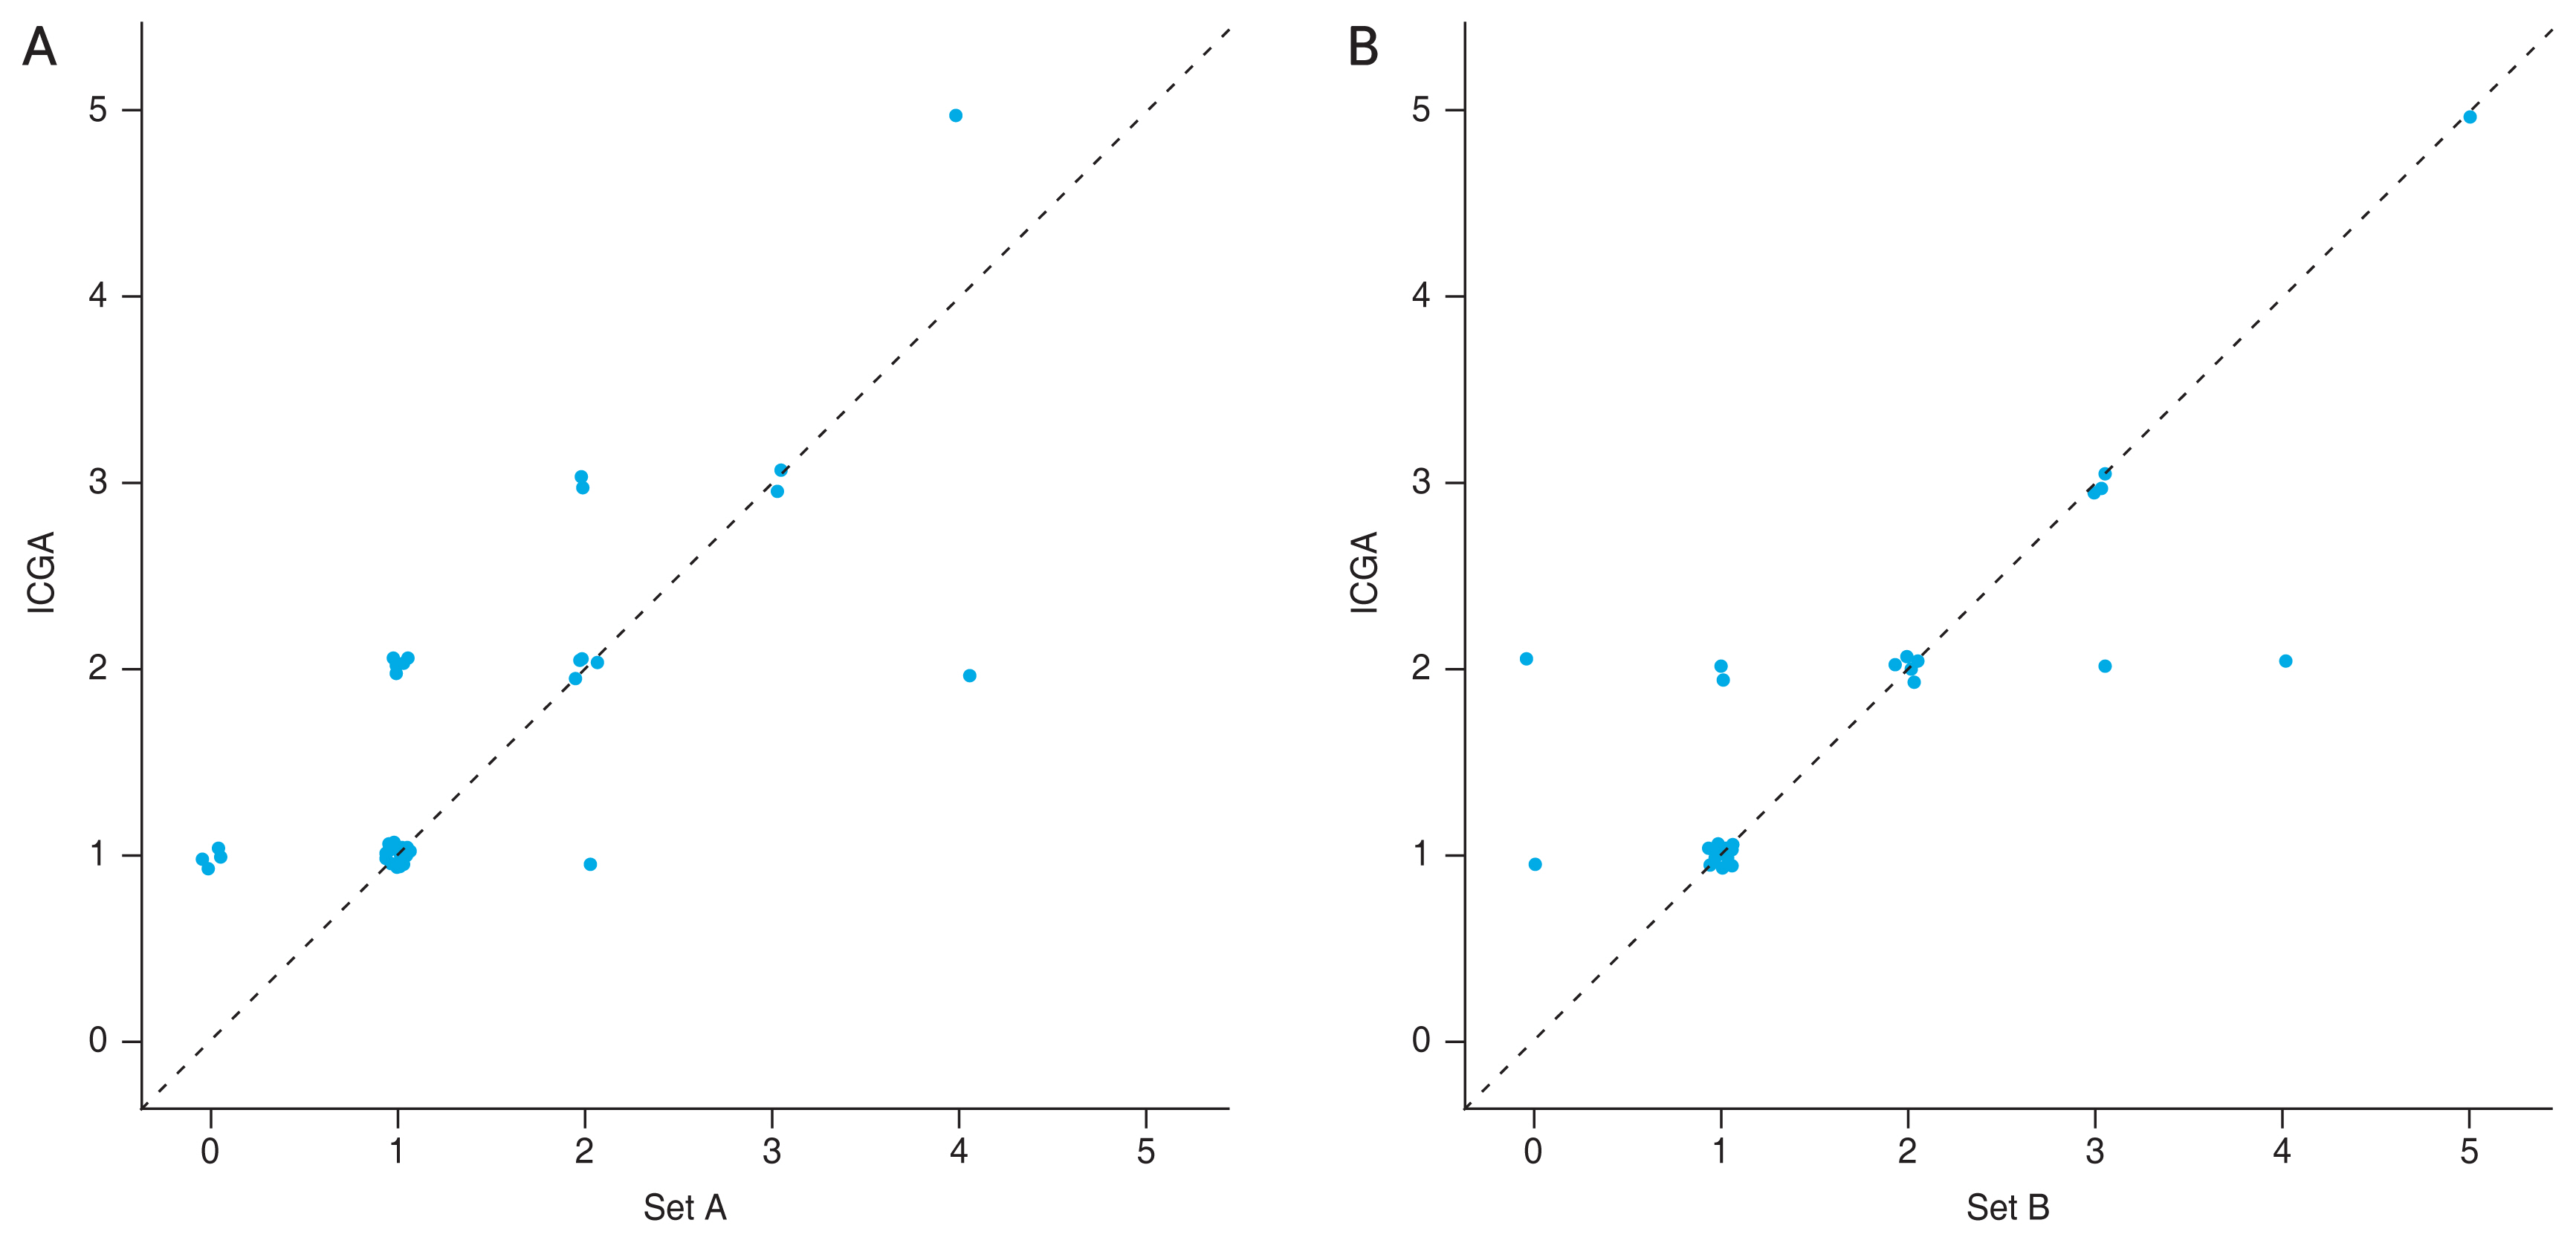
Scatter plots comparing the number of polypoidal lesions in set A (color fundus photography + optical coherence tomography), set B (color fundus photography + swept-source optical coherence tomography angiography) and indocyanine green angiography (ICGA) images. (A) Comparison between set A and ICGA in each patient with polypoidal choroidal vasculopathy. (B) Comparison between set B and ICGA in each patient with polypoidal choroidal vasculopathy.
Discussion
ICGA is the gold standard for the diagnosis of PCV and it is diagnosed by early subretinal hyperfluorescence and at least one of the criteria (nodular appearance of the polypoidal lesions on stereoscopic viewing, hypofluorescent halo around the nodule, large feeder vessel with a BVN, pulsatile filling of polypoidal lesions, orange subretinal nodules corresponding to the hyperfluorescent area on ICGA, massive submacular hemorrhage) [16,17]. However, it is invasive and a time-consuming method that needs alternative diagnostic technique. This study shows that combining CFP, OCT, and SS-OCTA images is possible to diagnose PCV without ICGA in untreated patients with PCV. Previous study [11] showed SS-OCTA only can be accurately diagnose components of PCV lesions such as BVNs and polypoidal lesions. However, in the previous study, sensitivity and specificity of PCV diagnosis could not be calculated and PCV cases were diagnosed based on ICGA findings before SS-OCTA images were reviewed. Therefore, graders already knew that polypoidal lesions and BVNs were present in each case. In this study, we evaluated patient with newly diagnosed exudative AMD undergoing image analysis. Therefore, our graders were unaware of the presence of polypoidal lesions and BVNs.
Set A and set B showed high sensitivity and specificity for diagnosing PCV in this study. Especially, in set B, which included SS-OCTA images, shows higher sensitivity, specificity, PPV, NPV and AUC and it is superior to OCT images. This result shows that en face images and blood flow signal in cross-sectional B-scan images are helpful in detecting polypoidal lesions and BVN to diagnose PCV. Blood flow signals between the RPE and Bruch membrane, as well as the sub-RPE ring-like lesion, demonstrate blood flow within the polypoidal lesions. This finding is valuable for diagnosing PCV in few cases (Fig. 2C, 5A–5F). Due to these advantages, SS-OCTA resulted in reduced false positive and false negative compared to the OCT-only group (set A), along with improvement in PPV and NPV.

Case images of a polypoidal lesion found in set B (color fundus photography [CFP] + swept-source optical coherence tomography angiography [SS-OCTA]) but not in set A (CFP + OCT). (A) Early phase indocyanine green angiography image of focal hyperfluorescent lesions. (B) En face OCT image which does not shows definite retinal pigment epithelium (RPE) elevation. (C) OCT image shows a pigment epithelial detachment, which is not sharp-peaked, and there is no definite sub-RPE ring-like lesion. (D) En face SS-OCTA image showing hyperreflective foci in polypoidal lesions. (E) Cross-sectional B-scan image shows sub-RPE ring-like lesion with green blood flow signals. (F) CFP shows orange subretinal round elevation.
Compared to ICGA images, set B showed comparable but lower polypoidal lesion detection rate than ICGA. This may result from manual segmentation and signal attenuation from PED and blood which can give less accuracy in en face images. In addition, lower blood flow rates in polypoidal lesions may also influence the lack of decorrelation signals when using SS-OCTA [13,19].
There were few studies, which used OCT without ICGA to diagnose PCV. Chang et al. [20] demonstrated high sensitivity of 0.857 and specificity of 0.862 in OCT-based PCV diagnosis for treatment-naive Korean eyes. Chaikitmongkol et al. [21] also suggested that without ICGA, the combination of CFP and OCT provides high sensitivity and high specificity for diagnose PCV. The image set of CFP and OCT demonstrated sensitivity of 0.83 (95% CI, 0.69–0.92), specificity of 0.83 (95% CI, 0.72–0.91), and AUC of 0.83 (95% CI, 0.76–0.90). However, fundus FA did not improve accuracy. Our study presented comparable outcomes for each parameter, including a sensitivity of 0.88, specificity of 0.94, and AUC of 0.90 (95% CI, 0.83–0.97) in set A.
Wang et al. [14] reported that in spectral domain OCTA, polypoidal lesion does not detect as clear as ICGA. However, BVNs showed as clear as ICGA. Kim et al. [11] demonstrated both polypoidal lesions and BVNs were well visualized as ICGA. The number of polypoidal lesions detection was 2.0 ± 1.0 in the ICGA group and 2.1 ± 1.2 in the SS-OCTA group. In our study, the number of polypoidal lesions were well detected as the previous study. The observed disparity is likely due to the resolution difference between spectral domain OCTA and SS-OCTA in two different studies, which SS-OCTA utilizes a longer wavelength of light and penetrates more effectively through the RPE [22,23].
Due to its superior resolution, SS-OCTA exhibited a higher correlation coefficient with ICGA for polypoidal lesion detection in set B compared to set A, as observed in the ICC analysis. Although ICGA is considered the gold standard for PCV diagnosis, it may not be able to provide a completely flawless polypoidal lesion detection. For example, there were few cases in which SS-OCTA detected more polypoidal lesions than ICGA (Fig. 6A#x02013;6C). In comparison to ICGA, SS-OCTA may exhibit greater accuracy, and it seems to be proven through subsequent research efforts.

Case images of a polypoidal lesion found in swept-source optical coherence tomography (SS-OCTA) but not in indocyanine green angiography (ICGA). (A) Early phase ICGA image of no focal hyperfluorescent lesions (circle). (B) En face SS-OCTA image showing hyperreflective foci in polypoidal lesions (circle). (C) Cross-sectional B-scan image shows subretinal pigment epithelium ring-like lesion with green blood flow signals.
As we know, this is the first study to analyze sensitivity, specificity, and AUC for diagnosing PCV in Korean patients using SS-OCTA. However, this study has several limitations. First, this study is retrospective in nature. Second, patients in this study included only Korean patients who have high incidence of PCV. This may cause bias in the analysis process. Therefore, further studies involving other ethnicities, such as the White population, among whom PCV is not prevalent, are required to generalize our results. Third, we evaluated en face SS-OCTA images through automatic segmentation of boundary layers extending from RPE to the RPE-fit, which required additional adjustments. To ensure accurate analysis, we optimized the slab thickness and performed custom segmentation. The exact position of the slab was manually adjusted from the boundary layer at the RPE to the RPE-fit. Then, we gradually decreased slab thickness and observed the flow signal on the B scans from the SS-OCTA to clearly differentiate polypoidal lesion’s signal from surrounding area. It indicates the necessity for future techniques to achieve accurate and rapid analysis of SS-OCTA images. Finally, only treatment-naive eyes are evaluated in this study. It seems that additional research is needed on how to evaluate PCV during follow-up period after the treatment of patients with PCV.
In conclusion, this study demonstrated that PCV can be accurately diagnosed with high sensitivity and specificity using OCT and SS-OCTA without using ICGA. Additionally, SS-OCTA demonstrates similar polypoidal lesion detection rates to ICGA while enhancing the overall sensitivity and specificity for PCV diagnosis.
Acknowledgements
None.
Notes
Conflicts of Interest
None.
Funding
None.