


The axial length is an indicator of eyeball size and the most important ocular biometry. It is measured in everyday ophthalmological practice since it is important to calculate the power of the intraocular lens before cataract surgery [1] as well as for the management of diseases where the axial length is related to their development or severity, such as myopic degeneration, normal tension glaucoma, or retinal detachment [2-4].
Many studies [5-7] have shown that myopic eyes have lower microvascular densities than normal eyes and a recent study [8] using wide optical coherence tomography angiography found that the microvascular reduction was more prominent in the temporal area. Moreover, retinal thinning in highly myopic eyes was not evident in the fovea but was seen in the peripheral areas, especially 9 mm from the fovea [8]. As the axial length increased, the retinal thickness and microvascular structure were altered. Thus, the retinal fundus images may reflect the axial length in multiple ways.
Many optical ocular biometers can measure the axial length using noncontact methods. Although the axial length can be easily measured with high precision, it is costly and time-consuming. Recently, Dong et al. [9] developed a deep learning model that uses conventional fundus images to predict the axial length, and the reported mean absolute error (MAE) for estimating the axial length was 0.56 mm. However, to the best of our knowledge, no studies have attempted to predict the axial length using ultra- widefield fundus (UWF) images, which can visualize up to 200° and therefore provide much more information regarding the peripheral areas. We hypothesized that deep learning models using UWF images would provide more accurate predictions than those using conventional fundus images.
In this study, we aimed to develop a deep learning model to predict the axial lengths of eyes using their UWF images. These findings may lead to a better understanding of the association of the axial length with the retinal changes in the UWF images.
Materials and Methods
Ethical statements
This study was approved by the Institutional Review Board of Seoul National University Hospital (SNUH; No. H-2202-069-1299). All procedures were conducted in compliance with the principles of the Declaration of Helsinki. The Institutional Review Board waived the need for written informed consent due to the retrospective design of the study and complete anonymization of patient information.
Dataset
We retrospectively enrolled all patients who visited the ophthalmology clinic at SNUH between September 2018 and December 2021. The inclusion criteria were patients with axial length measurements and UWF images that were taken within 3 months of the axial length measurement. The UWF images were obtained using the Optos California retinal imaging systems (Optos Inc). The axial length measurement device was an IOLMaster 700 (Carl Zeiss Meditec), a swept source optical coherence tomography-based ocular biometer. Eyes with an unmeasurable axial length on the IOLMaster 700 were excluded. Images were also excluded when the fundus was indistinguishable owing to severe media opacity, such as vitreous hemorrhage or dense cataracts. The exclusion criteria related to the quality of the fundus images were based on the vitreous haze grading [10]. If both the posterior pole and peripheral region details were hazy, corresponding to a vitreous haziness of grade 2 or higher, those images were excluded. However, images were still included if either the posterior pole or the peripheral region had haziness corresponding to vitreous haziness grade 1 or less. The dataset was divided into a development set and a test set at an 8:2 ratio with an equal distribution of axial lengths maintained between the sets (stratified splitting with binning). The development set and test set were constructed exclusively on the aspect of both the patient and eye to confirm that the images with the same eye did not belong to both the development and test sets. One image per eye was selected at random for the test set.
Data preprocessing and augmentation
We used automatically reconstructed pseudo-color UWF images. Data acquisition was performed by the big data center of SNUH. The image files were originally in the “DICOM” format. The files were subsequently converted into “png” format. The original size of the images was 3,900 × 3,072 pixels, and all images were resized to 300 × 300 pixels. All the RGB (red, green, blue) channels from the pseudo-color images were used. The images were not cropped as we aimed to preserve all the peripheral information. We used the following augmentations: horizontal flip (random rate, 50%), vertical flip (random rate, 50%), zoom (100%-130%), width shift (90%-110%), height shift (90%-110%), and brightness adjustment (80%-120%). These augmentations were applied to the images randomly at each epoch. Different augmentations were applied for each image in each epoch. Flipping augmentations were applied with a random rate of 50%. The remaining augmentations were applied with a random value from the range with a uniform distribution. These augmentations were used in the development and test sets. For the test set inference, we used all augmentations in the development set and averaged all the prediction values. This technique, the test time augmentation (TTA) technique, is well-known. We repeated TTA five times to minimize the errors of the prediction and bias from the augmentation options. We averaged five predicted values from TTA to calculate the prediction value.
Deep learning model development
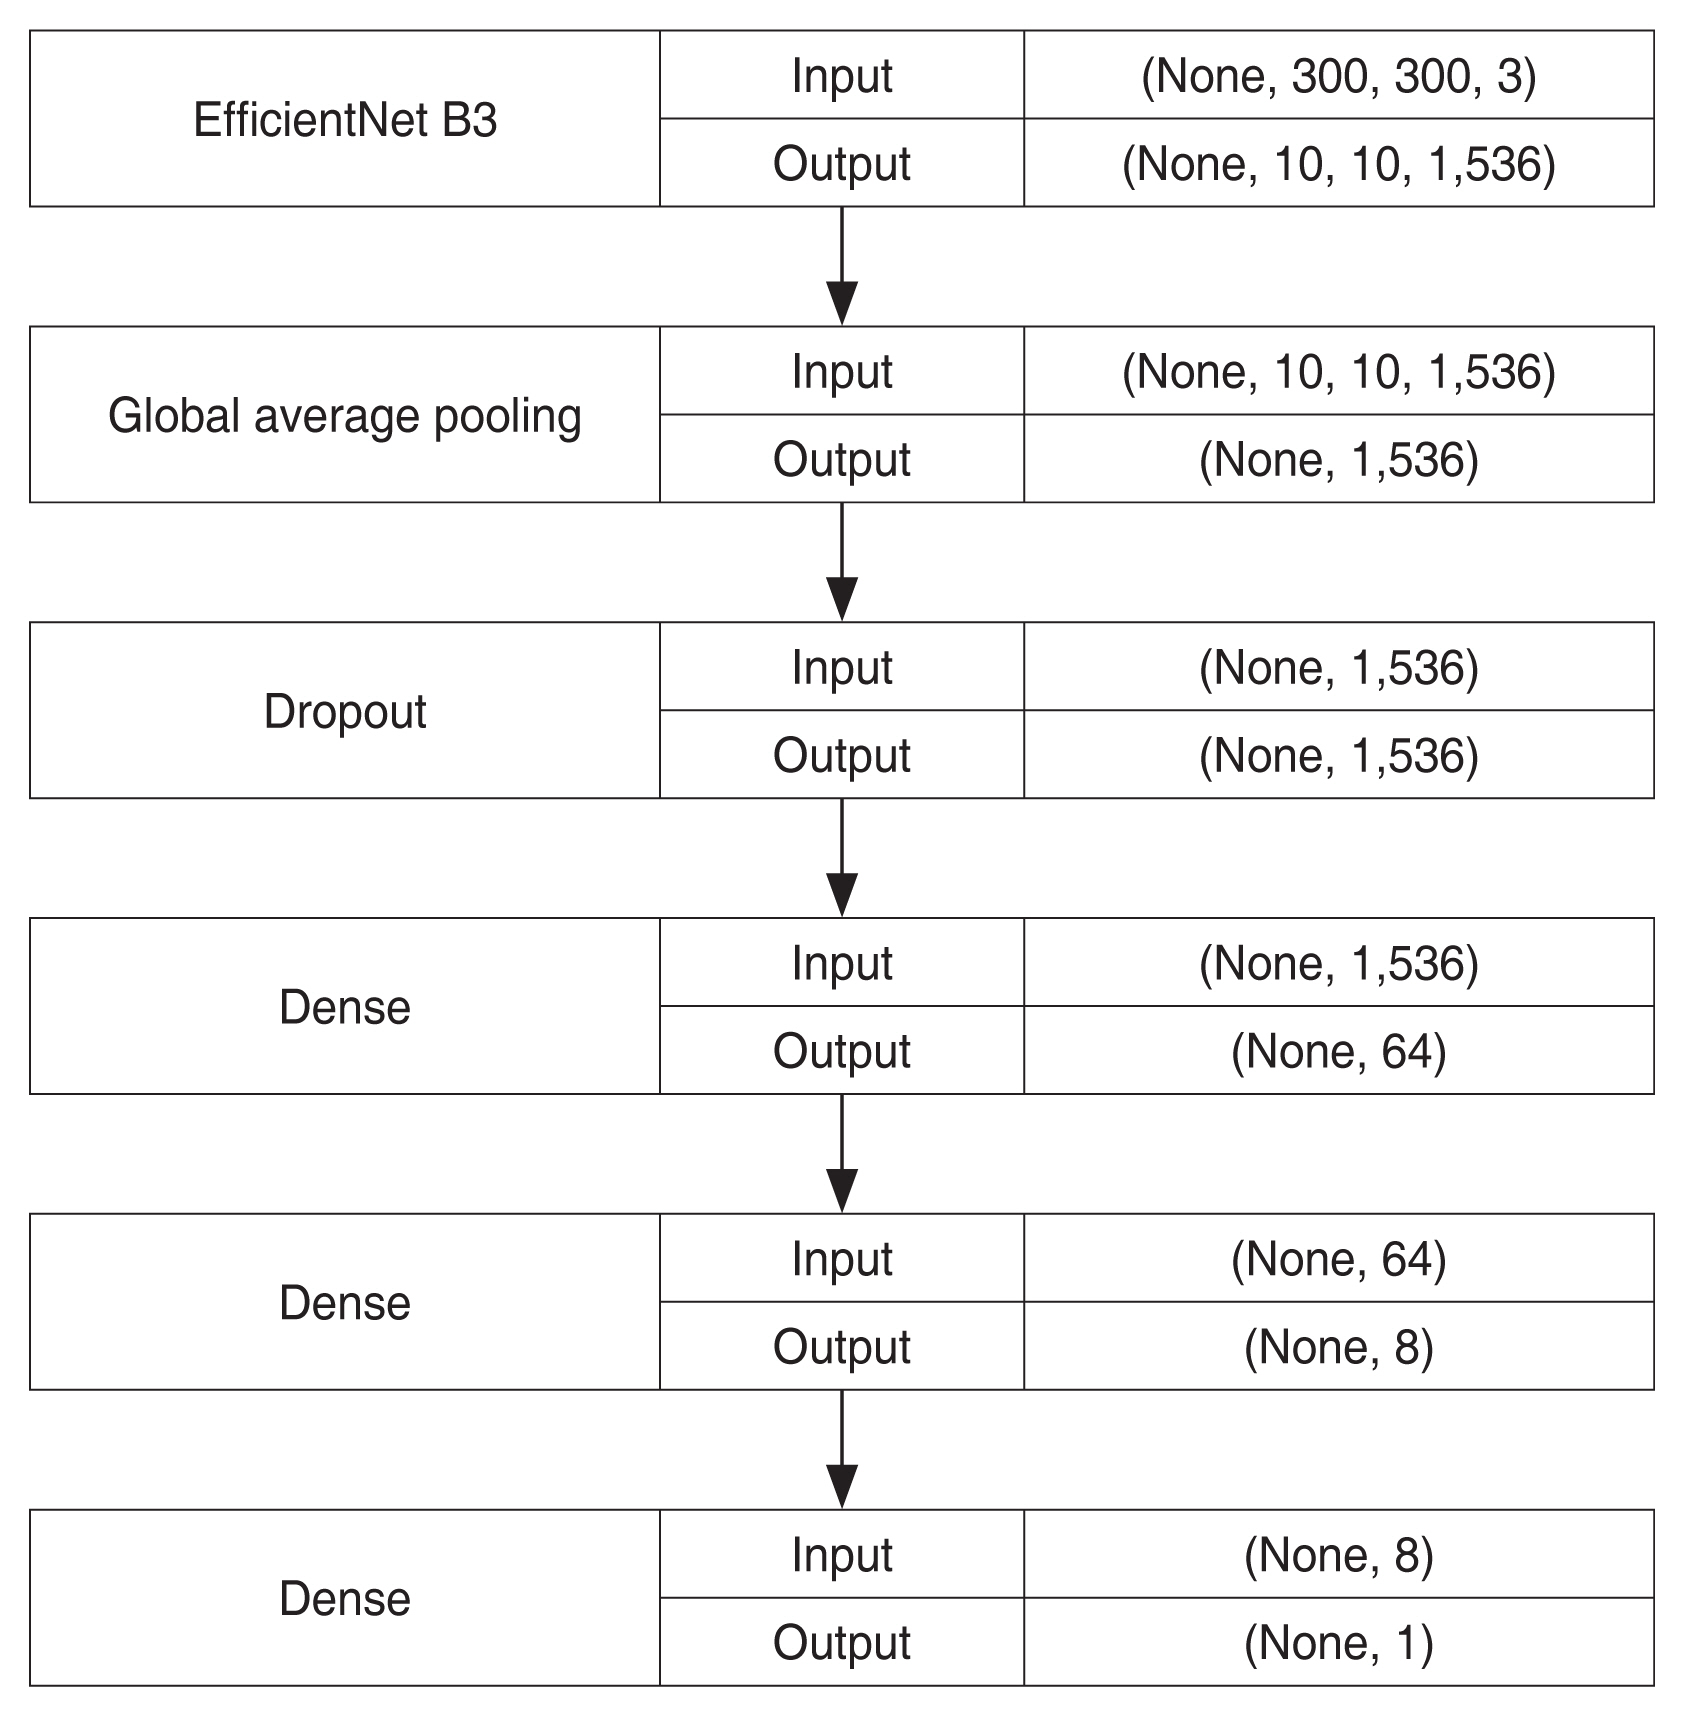
We used transfer learning, which is widely used in the medical field, to develop the model. EfficientNet (https://github.com/qubvel/efficientnet) [11] was used as the baseline architecture. EfficientNet is a publicly available light-weight convolutional neural network (CNN) architecture developed in 2019. Among EfficientNet B0 to B7, which is the largest EfficientNet model, EfficientNet B3 was chosen for the baseline architecture because of limited computing resources. Based on this architecture, we modified the last layer of the model, a dense layer with 1,000 outputs, into a dense layer with one output representing the axial length value. Before the last layer, we added a global average pooling layer, and the three following layers: a dropout layer with 0.15 of the dropout rate, a dense layer with 64 outputs and a “ReLu (rectified linear unit)” activation function, and another dense layer with eight outputs and a “Relu” activation function. Fig. 1 shows the simplified architecture of the model.
First, we initialized the parameters of the neural network with weights pretrained using ImageNet classification. Second, we froze all but the last four layers to ensure stable training. Training was performed for 20 epochs using the Adam optimizer (learning rate, 1 × 10⁻³). If the validation loss did not improve after seven epochs, the first-stage training was stopped. Third, we unfroze all the layers to fine-tune the weights. We trained the model for 100 epochs using the Adam optimizer (learning rate, 1 × 10⁻³). The learning rate was reduced to 20% when the validation loss did not improve within the five epochs. If the validation loss did not improve after 15 epochs, we interpreted it as the best-fit model. When this occurred, we stopped the second stage of training to avoid overfitting. Fivefold cross-validation was used for the development set. During the first and second stages of training, the mean squared error was used as the validation loss.
In the inference phase, we used five models from five-fold cross-validation to predict the axial lengths. Each model had an output value of the axial length, which was obtained by averaging the predicted values of the TTA process. We subsequently averaged five predicted values from five models to estimate the final output of the deep learning model.
We used a vanilla gradient saliency map to illustrate the fundus region predominantly used by the CNN model [12], called the “attention map.” With this technique, we were able to illustrate pixel-based heat maps that were important for the prediction. We used a vanilla gradient saliency map to illustrate the fundus region predominantly used by the CNN model.
Keras ver. 2.2.4 (https://keras.io) with Tensorflow back-end ver. 2.1.0 (https://www.tensorflow.org), a well-known deep learning framework, and Python ver. 3.7.11 (https://www.python.org) were used to develop the model. All development and inferences were performed on a private server equipped with a central processing unit (CPU) with 32 GB random-access memory (RAM) and an NVIDIA GeForce GTX 1660 Ti with 6 GB graphics processing unit (GPU; Nvidia).
Analysis of results
We calculated the MAE, R-squared (R2), and their 95% confidence intervals (CIs) using the bootstrap method. From the test set, the same amount of data as the test set was resampled with allowance for repetitive samples for MAE and R2 evaluation. This process was repeated 2,000 times to calculate the CIs.
Results
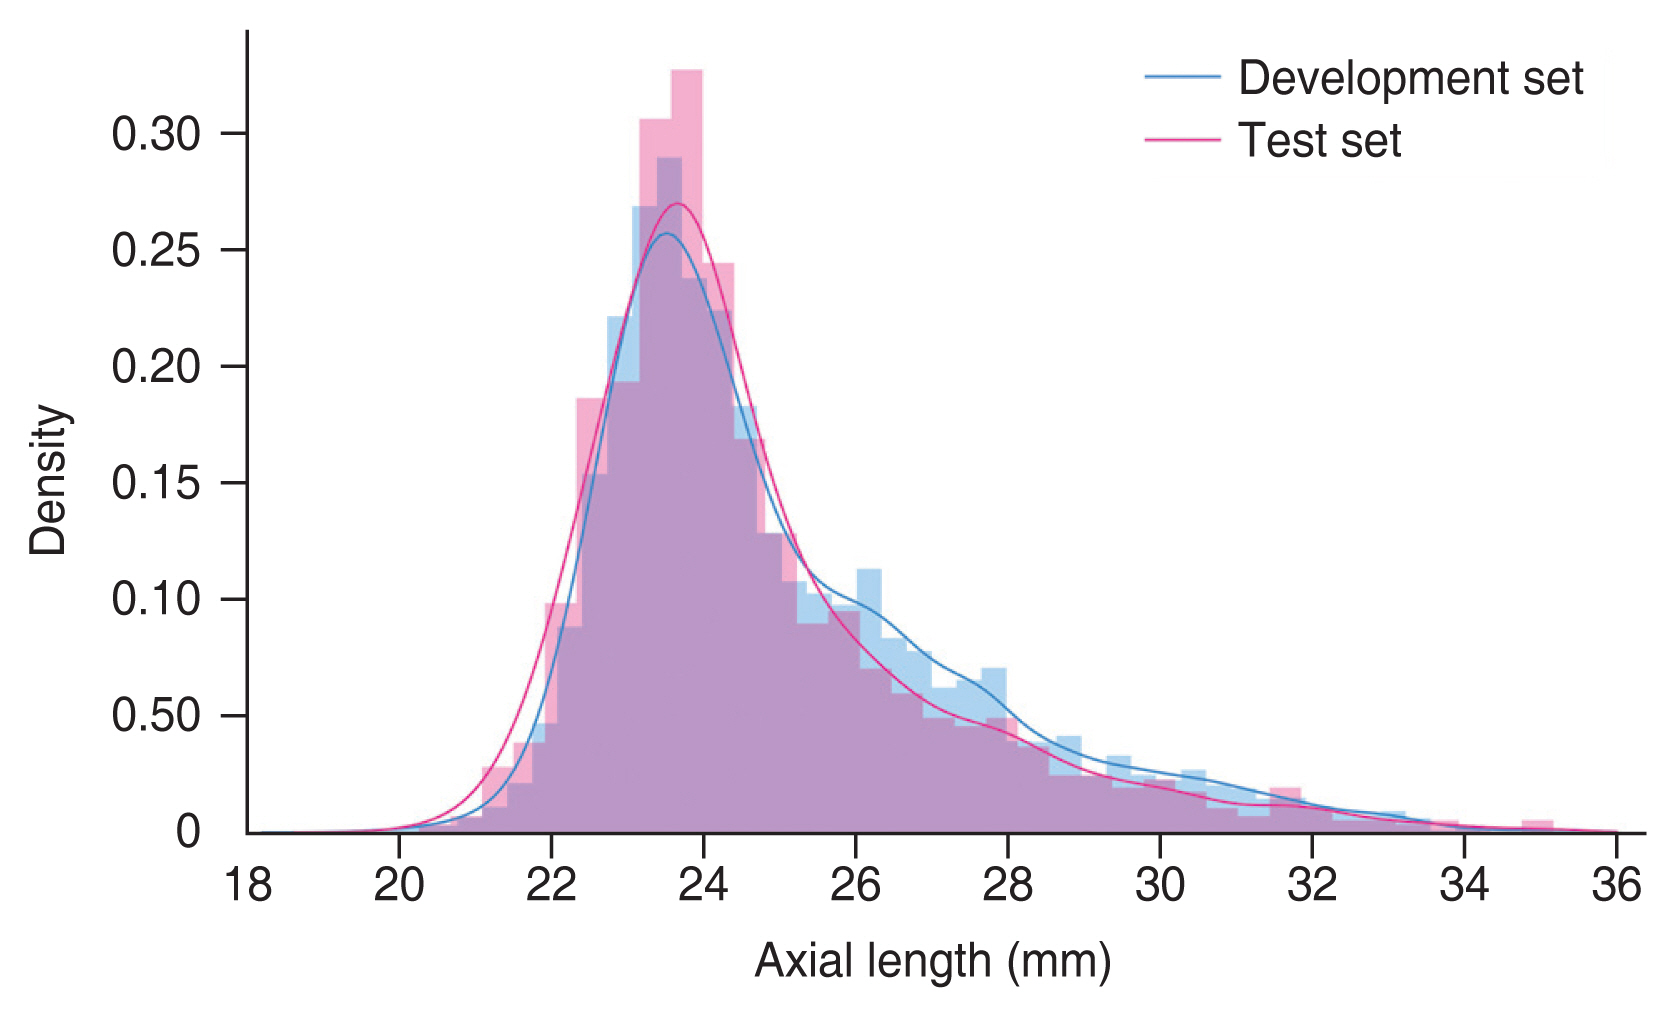
A total of 8,254 UWF retinal fundus images from 3,829 patients (mean age, 63.98 ± 15.25 years) were included in the study. The mean axial length was 24.67 ± 2.30 mm. Among them, 6,884 UWF retinal fundus images from 3,063 patients were included in the development set, and 1,370 UWF retinal fundus images from 766 patients were included in the test set. UWF photos per eye were 1.27 (range, 1-7) in total, 1.26 (range, 1-7) in the development set, and 1.00 (range, 1-1) in the test set. Table 1 summarizes the demographic and clinical information of the total dataset, the development set, and the test set. The distribution of the axial lengths for each set is shown in Fig. 2.
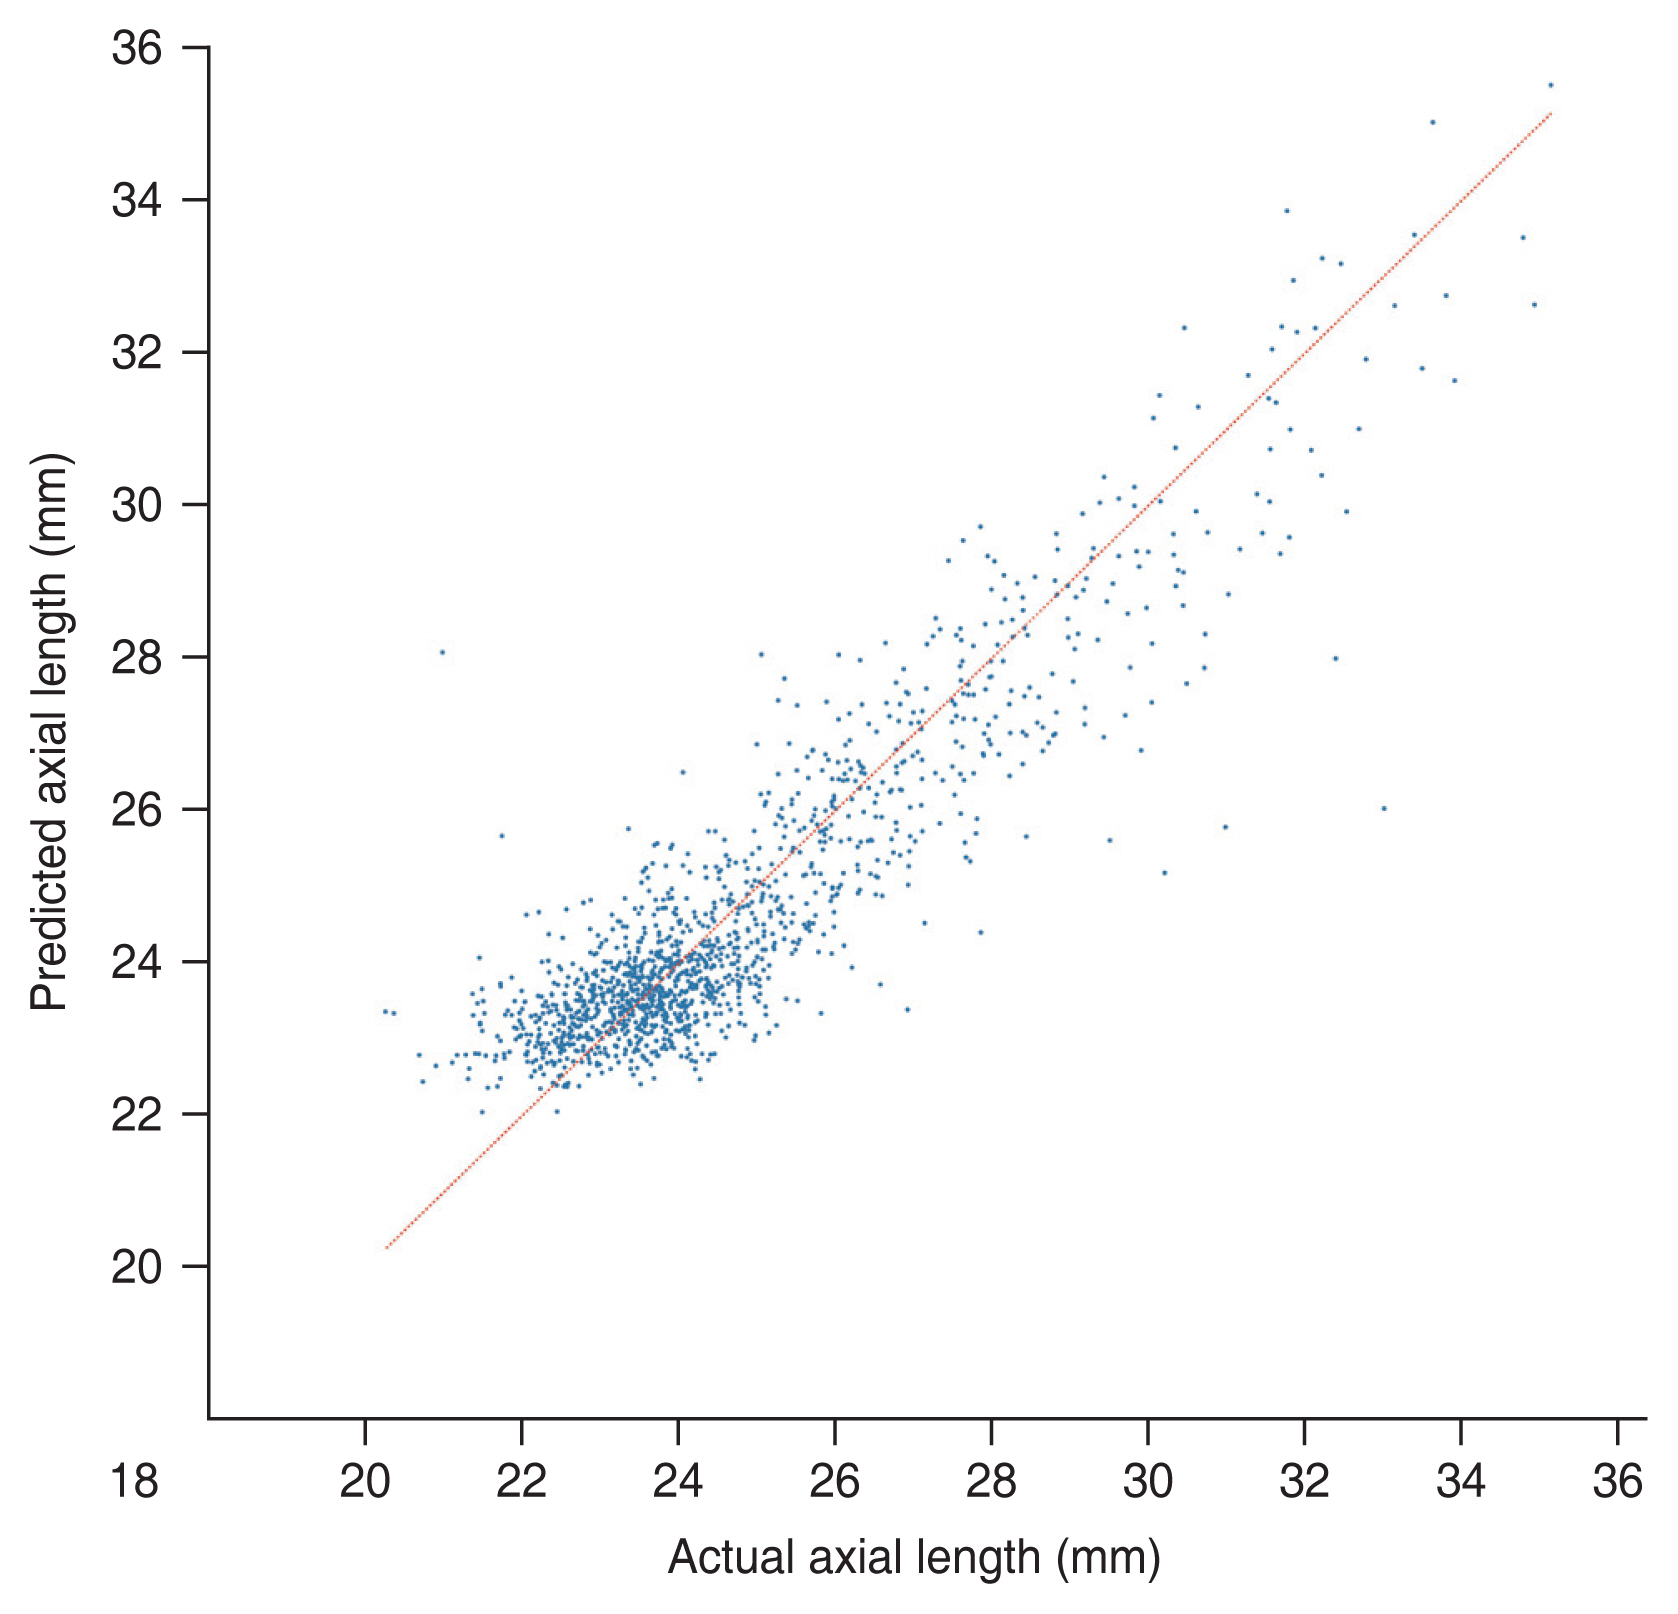
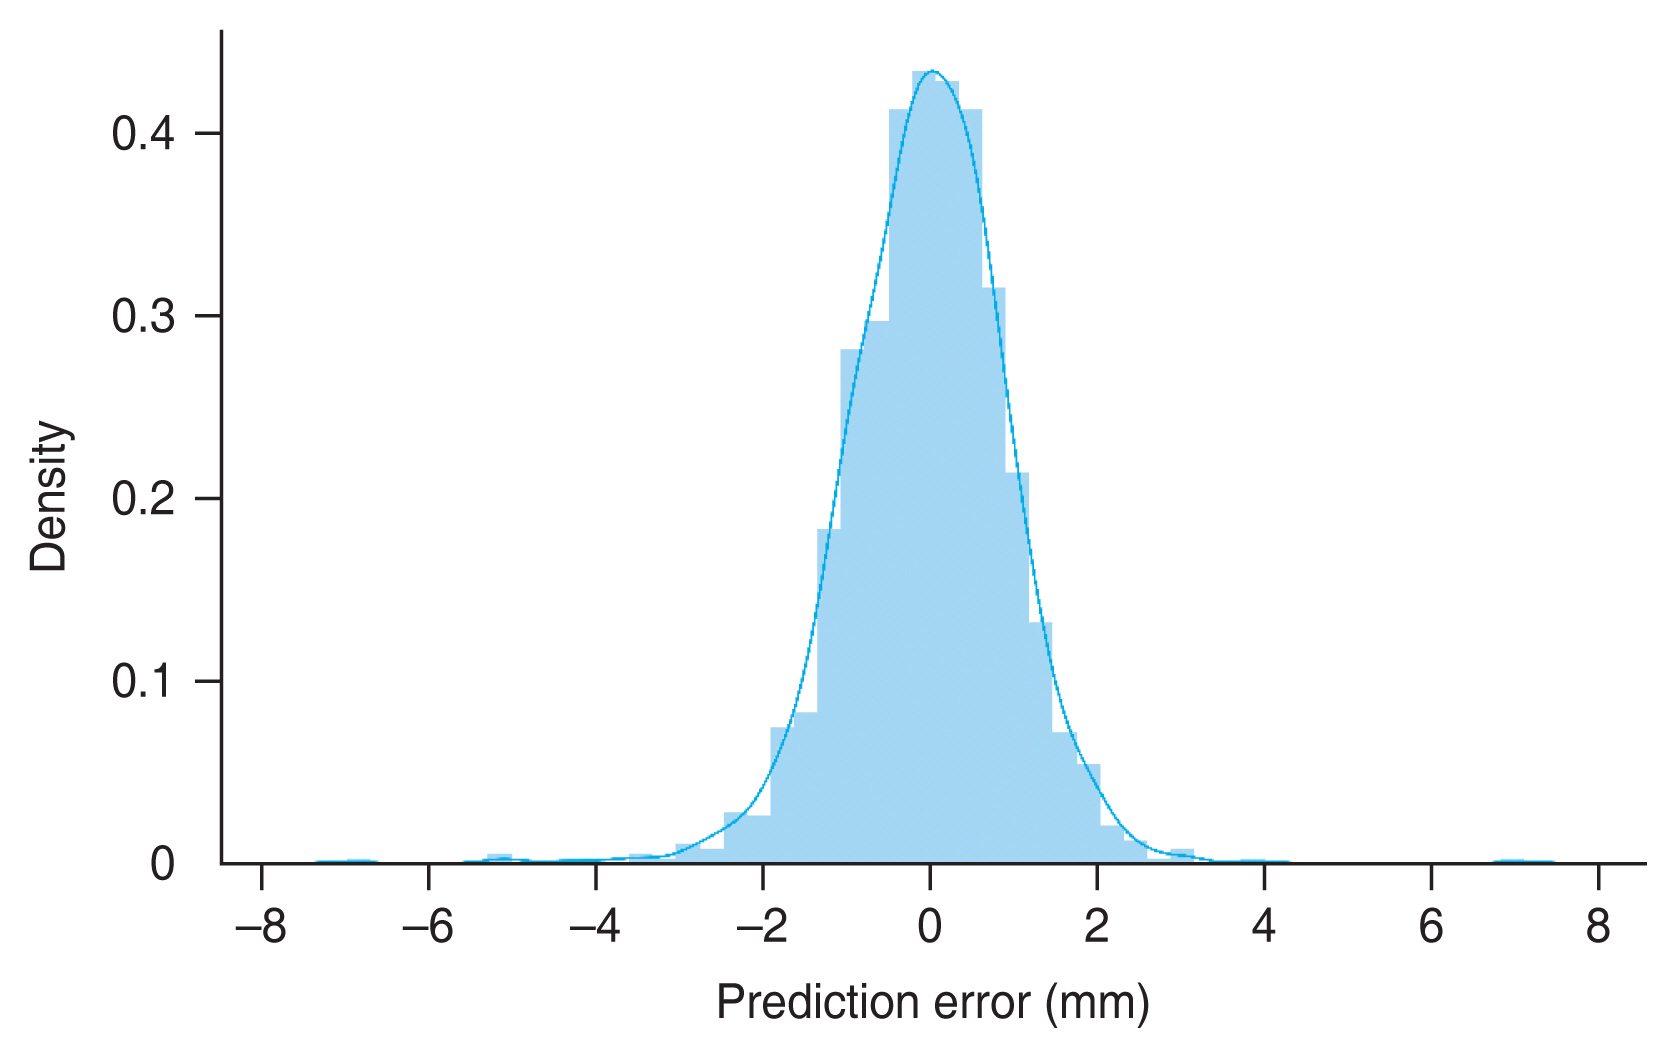
Our deep learning model was able to predict the axial length of the eye using UWF retinal fundus images. MAE and R2 value of the test set were 0.744 mm (95% CI, 0.709-0.779 mm) and 0.815 (95% CI, 0.785-0.840), respectively. Fig, 3 shows the results of the inference with the test set. The red line represents the exact value for each eye. Fig. 4 shows the distribution of the difference between the actual and predicted axial lengths. As shown in Table 2, the model had 73.7%, 95.9%, and 99.2% accuracy in prediction, with error margins of ±1.0, ±2.0, and ±3.0 mm, respectively.
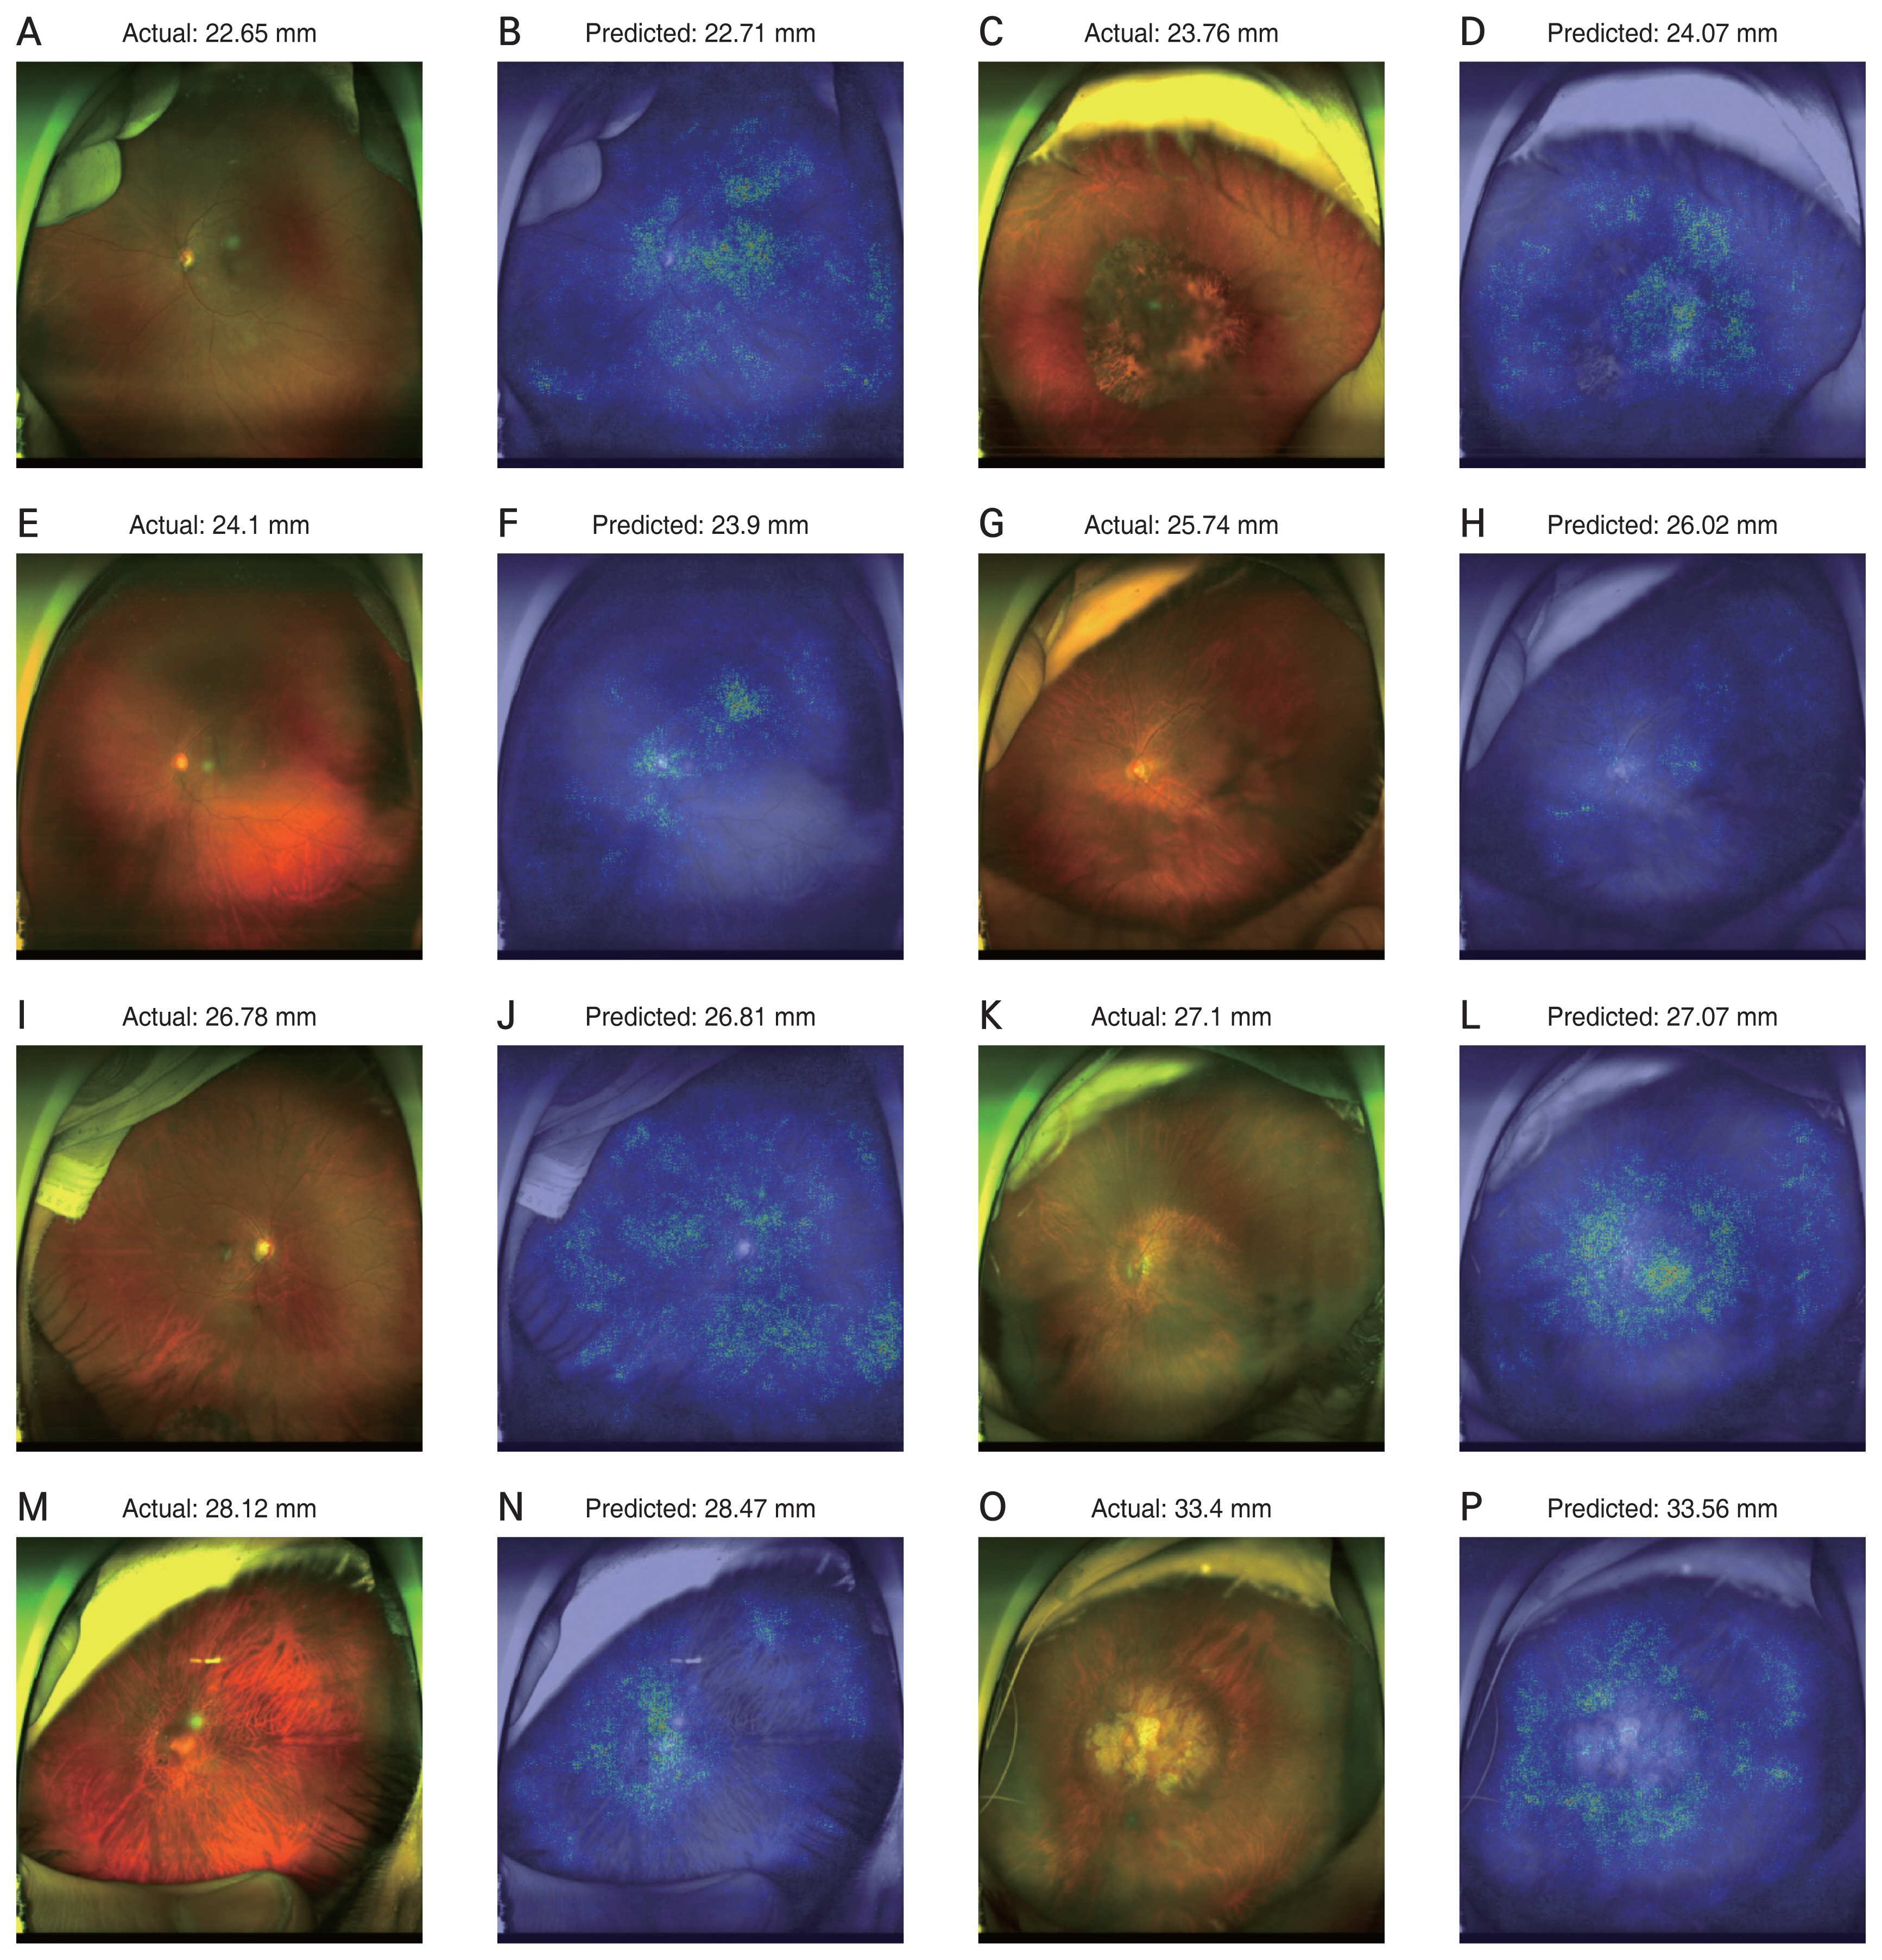
Heat map analysis using a vanilla gradient technique identified the region of importance in predicting axial length in the UWF retinal fundus images. Examples of the attention maps are shown in Figs. 5A-5P, 6A-6L, and 7A-7P.
Discussion
This study proposes a deep learning model to predict the axial lengths of eyes from their UWF fundus images. The MAE of the predicted axial length was 0.744 mm (95% CI, 0.709-0.779 mm), and the R2 value of the prediction was 0.815 (95% CI, 0.785-0.840). To the best of our knowledge, this is the first study to develop a deep learning-based axial length prediction model using UWF fundus images.
Our results are comparable with those observed in previous studies. Although the MAE of our model was between the results of two previous studies [9,13], the R2 value of the present model was much greater than those of the previous studies. Dong et al. [9] proposed a model with an MAE of 0.56 mm (95% CI, 0.53-0.61 mm) and an R2 value of 0.59 (95% CI, 0.50-0.65), while a model proposed by Jeong et al. [13] had an MAE of 0.90 mm (95% CI, .0.85-0.91 mm) and an R2 value of 0.67 (95% CI, 0.58-0.87) [13]. Our study also enrolled a larger number of patients and images than previous studies. Moreover, the eyes included in our study had axial lengths ranging from 19.44 to 35.83 mm, which includes all the extreme values to improve generalizability. Furthermore, we did not exclude patients based on their age. Therefore, the age of our study participants ranged from 5 to 95 years.
The average axial length of newborns is approximately 17 mm [14] and all eyes experience an expansion period. During the expansion period, both the posterior pole and peripheral fundus are affected. Eyes with long axial lengths tend to have visible large choroidal vessels, which are known as tessellated fundus [15]. Moreover, it is well-known that myopia is associated with peripapillary atrophy which is caused by an offset between the lamina cribrosa and Bruch’s membrane opening [16]. These previous studies suggest that axial elongation affects the retinal fundus images in multiple ways. Therefore, instead of investigating each part of the fundus, all retinal regions should be considered when estimating the axial length. Since the deep learning architecture is appropriate for analyzing whole retinal information, our model aimed to show valuable performance in the estimation of axial length. Moreover, in eyes with high myopia, retinal thinning was not evident in the fovea but was evident in the peripheral areas, especially 9 mm from the fovea [8]. Peripheral retinal information may be important for axial elongation. UWF fundus images have an advantage with regards to peripheral information because they visualize up to 200°.
The attention map showed that peripheral information is important in predicting axial length. Previous studies using conventional fundus images only provided information on the posterior pole and not the peripheral region [9,13]. The UWF provides more information from peripheral retinal images, therefore our model is likely to predict axial lengths more accurately. Most of the attention map images showed both the posterior pole and peripheral regions. Some eyes with a long axial length showed high signals only in the peripheral region, not in the macula or disc. Examples are shown in Fig. 5. Some eyes with a long axial length showed more high signals in the peripheral region than in the macula or disc. As shown in Fig. 7, deep learning models seemed to refer to fundus tessellation or peripheral degeneration as well as the disc or macular area while predicting the axial length in high myopic eyes. However, since the attention maps did not offer quantitative analysis and cannot explain the logic, further research is needed to compare the superiority in regional importance for predicting the axial length.
Our model overestimated the axial length for eyes with a short axial length and underestimated the axial length for eyes with a long axial length. This result is consistent with the previously discussed studies [9,13]. Retinal microstructural alteration might be limited since each retinal layer should have a minimum thickness. For extremely long axial length eyes, because retinal microstructural alteration has already reached its limits, the structural difference or variation might not be large, resulting in an underestimation of the long axial length. All studies on this topic had similar results, in that the deep learning models overestimated the axial length of the short eyes. This phenomenon has not been previously discussed. This may be due to the limitations of the deep learning architecture. Fig. 6 shows some examples in which ophthalmologists might not have been able to assume the axial lengths accurately, but a deep learning model could. Fig. 6A-6D shows the results of eyes with previous panretinal photocoagulation treatment. Residual fundus regions showed a high signal in the heatmap analysis. The prediction errors were within 0.8 mm. In Fig. 6E and 6F, an eye with rhegmatogenous retinal detachment shows the prediction error less than 0.5 mm. The deep learning model used both the detached retina and attached retinal information to predict the axial length. In Fig. 6G and 6H, an eye which previously underwent a previous encircling operation shows the prediction error of 2.46 mm. Since encircling operations altered the retinal structures and axial length, the model prediction error was slightly greater than the others. Fig. 6I-6L are example of long axial length eyes. Both eyes had a tessellated fundus and large peripapillary atrophy. The deep learning model predicted them with great accuracy.
Most of the included eyes had various diseases, including severe diabetic retinopathy or retinal detachment. Our study included many eyes that had already been treated with laser photocoagulation or intravitreal injection, or had already undergone various surgeries. These previous treatments or diseases may result in bias. However, most ophthalmologists do not routinely measure the axial length of eyes, but in axial length-related diseases, such as myopic degeneration, retinal detachment, or glaucoma. The study population was from a real-world clinical setting. Therefore, our model has the advantage of generalized usage. However, we believe that a much greater proportion of normal-looking images would improve the performance of our model as they would provide more images with clearly visible retinas.
The proportion of eyes with absolute error between predicted axial length and actual axial length smaller than 1.0, 2.0, and 3.0 mm were 73.7%, 95.9%, and 99.2%, respectively. Some eyes showed clinically significant differences between the predicted and actual axial lengths. Therefore, the predicted values should be used with caution. Averaging multiple prediction values from different UWF fundus images would decrease the prediction errors as the UWF images of the same person on the same day may be highly variable in terms of field of view and image quality, such as white balance and brightness, as well as the capture angle.
The UWF fundus images, unlike conventional fundus images have various artifacts, such as eyelashes, eyelids, and the examiners’ fingertips. These artifacts should be considered because they can also be used in the training process. Although, for most cases, peripheral artifacts did not show high signals in the heatmap analysis, some showed partially high signals in the peripheral artifact region, which could have caused bias. Image preprocessing, such as cropping or segmentation, might improve performance. However, this preprocessing also has disadvantages such as losing peripheral information from the retinal fundus, and peripheral artifacts are too irregular to be removed from the image. Thus, we did not use a custom cropping function, but instead used the zoom preprocessing function of Keras, which randomly ranged from 100% to 130%. The zoom function with a value greater than 100% meant cropping the residual periphery after magnifying images with the same pixel size. Further studies with proper preprocessing may improve the performance of the model.
Our study had several limitations. First, most axial length measurements were performed before surgery, including cataract surgery or vitrectomy. Therefore, 82% of the images were from phakic eyes, which may have a substantial amount of haziness. The performance of the model might be improved with more clearly visible fundus images. Second, all patients were Asian from a single tertiary center with one UWF device. Our model may have greater errors if adapted to the eyes of other ethnicities or images acquired by other equipment. Further studies with external validation sets are required to generalize our results. Third, the attention map does not guarantee a causal relationship between the retinal lesions and axial length due to its nature. Finally, all images were downsized to 300 × 300 pixels, which is the default input size for EfficientNet B3. Prediction using downsized images results in the loss of some detailed information, resulting in substantial errors. Owing to the limited computational resources, we were unable to train with more complex models or use greater input image sizes. Training with larger input image sizes may result in a better performance.
In conclusion, we proposed a deep learning-based model that estimates the axial length from UWF images with good performance. This study may be helpful not only for estimating axial length based on UWF images but also for the investigation of retinal fundus lesions affecting axial length elongation.


 PDF Links
 PubReader
 ePub Link
 Full text via DOI
 Full text via PMC
 Download Citation
 Print
Print