


Glaucoma is a chronic and progressive optic neuropathy characterized by optic nerve head change with corresponding visual field (VF) defects [1]. VF testing is still the most important means of characterizing visual-loss level in glaucomatous eyes and of detecting progressive damage [2]. Studies have stressed the importance of thorough VF testing in order to identify patients at the highest risk of symptomatic vision loss, those progressing at a rapid rate and those manifesting central VF damage [3,4].
There has been recent and increasing interest in more objective, faster, and more repeatable imaging techniques for evaluation of structural damage in glaucoma patients. Most notably, optical coherence tomography (OCT) has been improved markedly in terms of imaging protocols, algorithms, and new parameters, all of which have enhanced its glaucoma diagnosis and progression-assessment utility [5]. By contrast, VF testing tends to be a long and tiring as well as variable process that is reliant on often-inexperienced examinersŌĆÖ subjective observation and analysis [6].
In this context, although VF testing remains a central component of examination for glaucoma and glaucoma-suspect patients, clinicians recently have become increasingly reliant upon computerized imaging technologies in the diagnosis and monitoring of glaucoma [7]. Therefore, the goal of this study was to analyze the last decadeŌĆÖs trends (2010-2019) in VF test utilization for adult glaucoma or glaucoma-suspect patients based on the available Korean Health Insurance Review and Assessment (HIRA) data. Specifically, we analyzed data at tertiary hospitals in an attempt to improve the accuracy of diagnostic codes in glaucoma or suspect patients and to focus on glaucoma subspecialistsŌĆÖ practice.
Materials and Methods
Ethics statement
This study was exempted from any necessity of review by the institutional review board of Jeju National University Hospital, since it did not collect or record any information of a personally identifiable nature.
Data sources
We accessed health claims recorded from 2010 to 2019 via KoreaŌĆÖs HIRA service. In Korea, a single national insurer, the National Health Insurance system, is responsible for the health insurance of almost 97% of the Korea-resident population [8]. Medical claims made to the National Health Insurance consist of demographic information, diagnoses, procedures, prescription records, and inpatientsŌĆÖ and outpatientsŌĆÖ direct medical costs. All health claims thus submitted are reviewed by HIRA, which references the Korean Standard Classification of Disease (7th revision) that includes several changes specifically related to the Korean situation according to the International Classification of Diseases (10th revision). Those among the population not insured by National Health Insurance (3% of the population) are covered by either the Medical Assistance Program or the Medical Care for Patriots and Veterans Affairs scheme. Any claims submitted under these schemes also are reviewed by HIRA. The HIRA database, therefore, covers the entire population and their medical claims.
The HIRA database is restricted; access is permitted only once and the approval by the HIRA Deliberative Committee is granted for studies conducted for the common good. Subsequent to our studyŌĆÖs approval, we identified glaucoma patients registered during the 2010 to 2019 period using the glaucoma diagnostic codes H40 (glaucoma) and H42 (glaucoma in other diseases classified elsewhere). The H40 code covers diagnoses of glaucoma suspect (or ocular hypertension, H400), open-angle glaucoma (H401, including normal-tension glaucoma and primary open-angle glaucoma), angle-closure glaucoma (H402), secondary glaucoma (H403-406), other glaucoma (H408), and unspecified glaucoma (H409). The H42 code category includes endocrine-, nutritional-, and/or metabolic-disease-related diagnoses (H420). To obtain VF testing data, we identified cases with the codes E6690 (kinetic perimetry) and E6691 (standard automated perimetry [SAP]).
For the final analysis, we focused on data at tertiary hospitals in an attempt to improve the accuracy of diagnostic codes for glaucoma or suspect patients. A previous study on diagnostic accuracy in HIRA data showed that diagnoses tend to be more accurate for severe conditions rather than minor ones, for inpatient settings than for outpatient ones, and in hospitals than in clinics [9]. Further, since most of the glaucoma subspecialists in Korea are concentrated in tertiary hospital, we intended to focus on glaucoma subspecialistsŌĆÖ practice.
For verification of glaucoma diagnosis, we accessed information on any antiglaucoma medication prescriptions and ocular surgery history. The antiglaucoma medications were classified according to the applicable HIRA drug-ingredient codes (Supplementary Table 1). The surgical codes, meanwhile, were those for the following procedures: nonpenetrating filtering surgery (S5040), iridotomy (S5041), filtering surgery (S5042), trabeculectomy (S5043), cyclophotocoagulation (S5044), cyclocryosurgery for glaucoma (S4055), trabeculotomy (S4057), sinusotomy (S4058), and glaucoma implant surgery (S5049).
Statistical analysis
A statistical analysis was conducted by R ver. 3.6.1 (The R Foundation for Statistical Computing, Vienna, Austria; https://www.r-project.org/). The parameters analyzed were as follows: (1) annual number of VF tests (kinetic perimetry or SAP) performed for glaucoma or glaucoma-suspect patients; (2) annual number of glaucoma or glaucoma-suspect patients with at least one VF test (kinetic perimetry or SAP); (3) 10-year trends of average number of VF tests per glaucoma patient; and (4) average number of VF tests per patient according to age (in 10-year increments). When a series of measurements are obtained according to a time series, trend estimation can be used to make and justify statements on tendencies in the data by relating the measurements to the times at which they occurred [10]. Therefore, in order to explore any decadal changes in VF test utilization, we conducted a linear regression trend analysis.
Results
Ten-year trends in utilization of VF tests
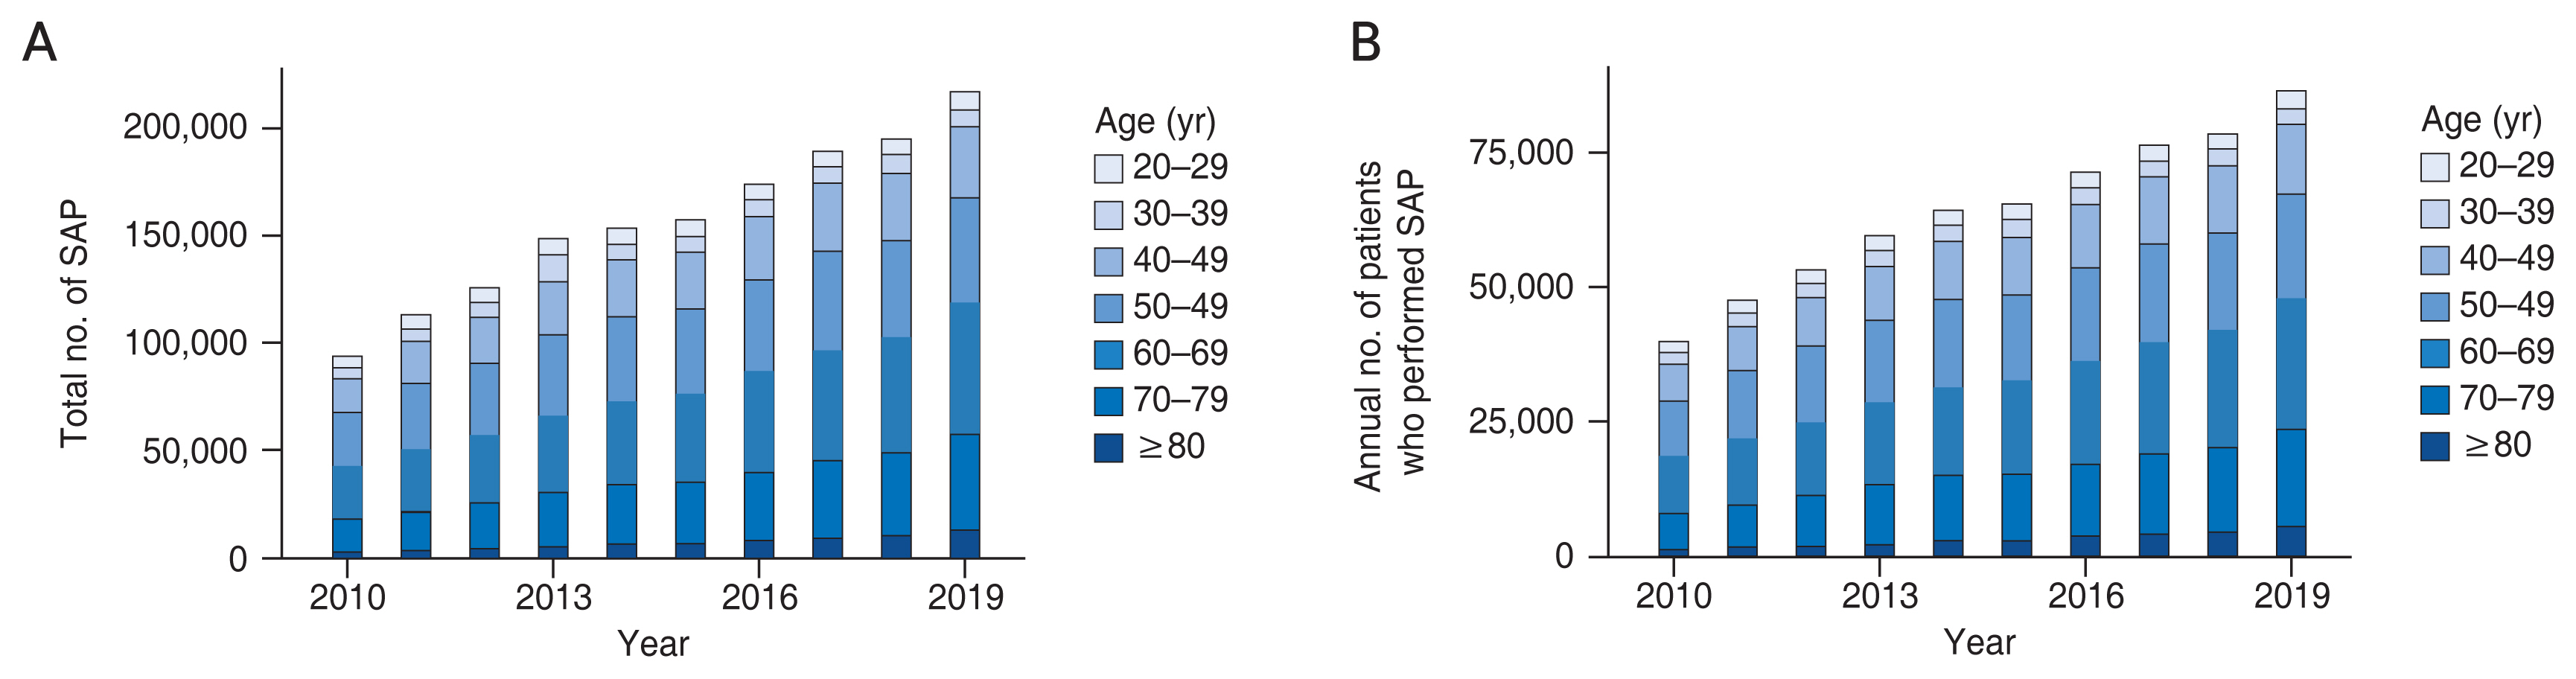
The total number of SAP procedures performed in tertiary hospitals for either glaucoma or glaucoma-suspect patients gradually increased over the course of 2010 to 2019, from 93,459 to 216,433 (Fig. 1A). The number of glaucoma patients also increased from 73,716 to 124,442 during this period. There was a significant trend of increase in the annual average number of SAP performed per one glaucoma patient (from 0.63 to 0.87, ╬▓ = 0.024, R2 = 0.940, p < 0.001). During this decade, the average number of glaucoma or glaucoma-suspect patients on whom at least one SAP was performed increased steadily as well (Fig. 1B). The annual average for the number of tests performed per patient who underwent at least one SAP showed a slight increase, from 1.168 to 1.248 (╬▓ = 0.008, R2 = 0.669, p = 0.004).
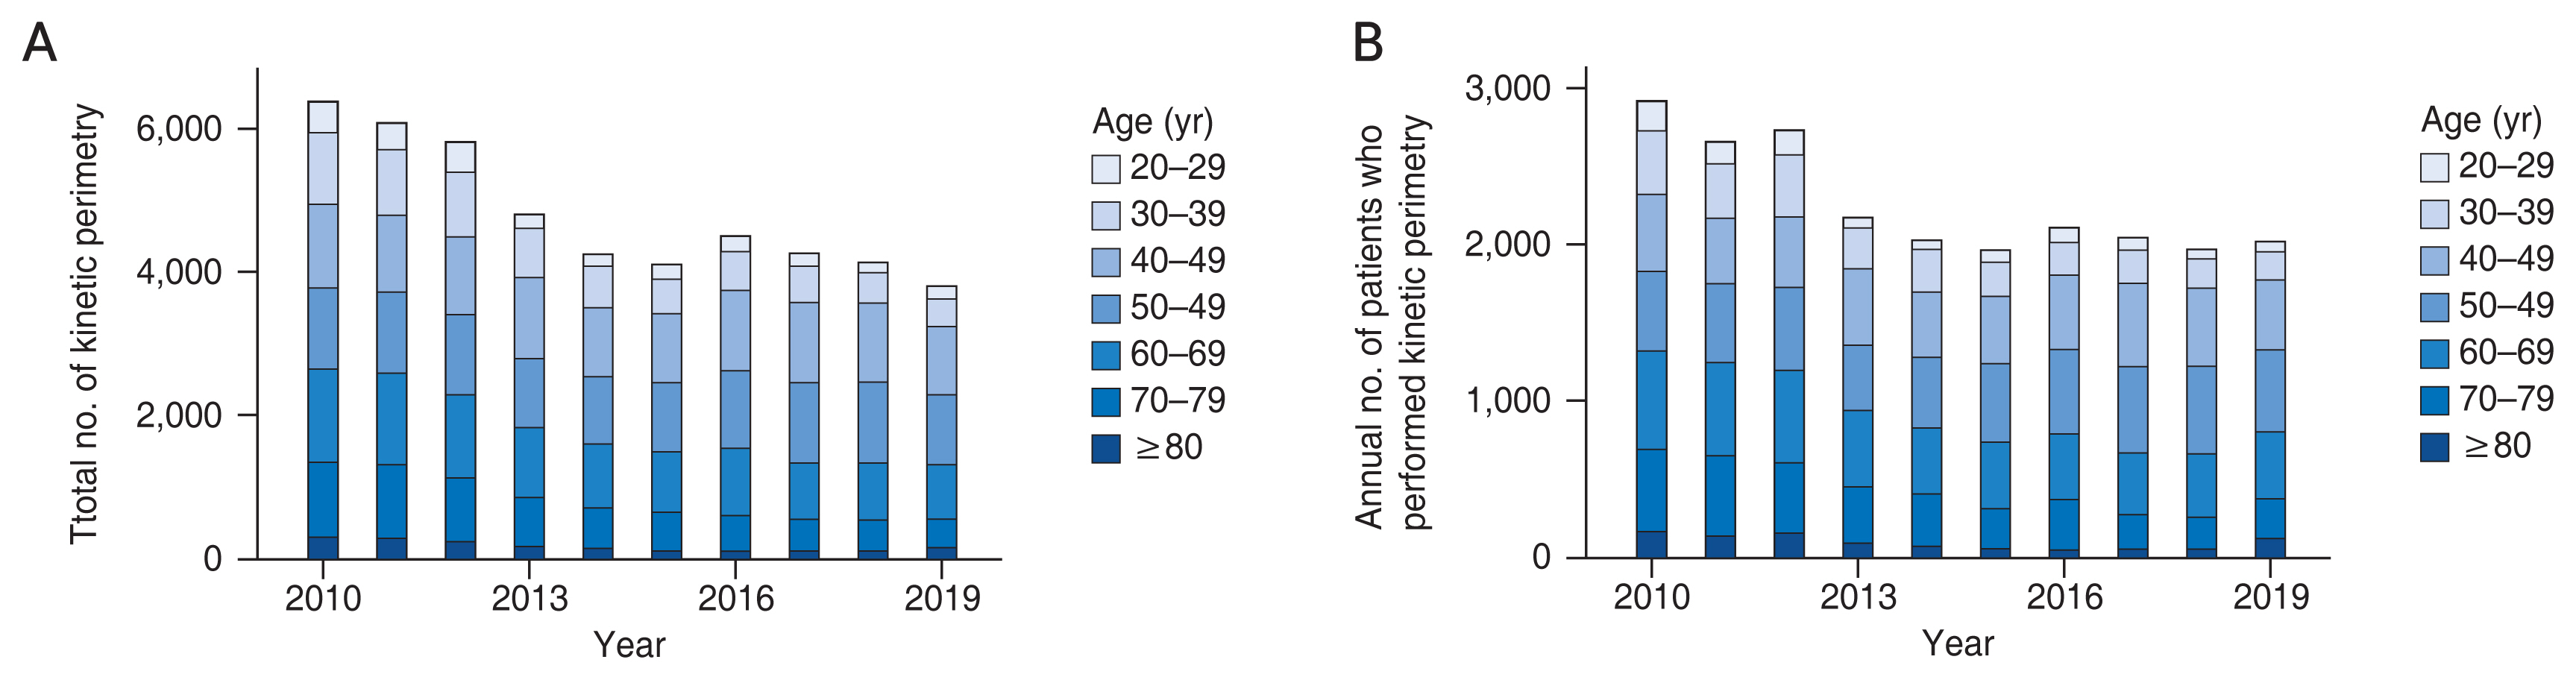
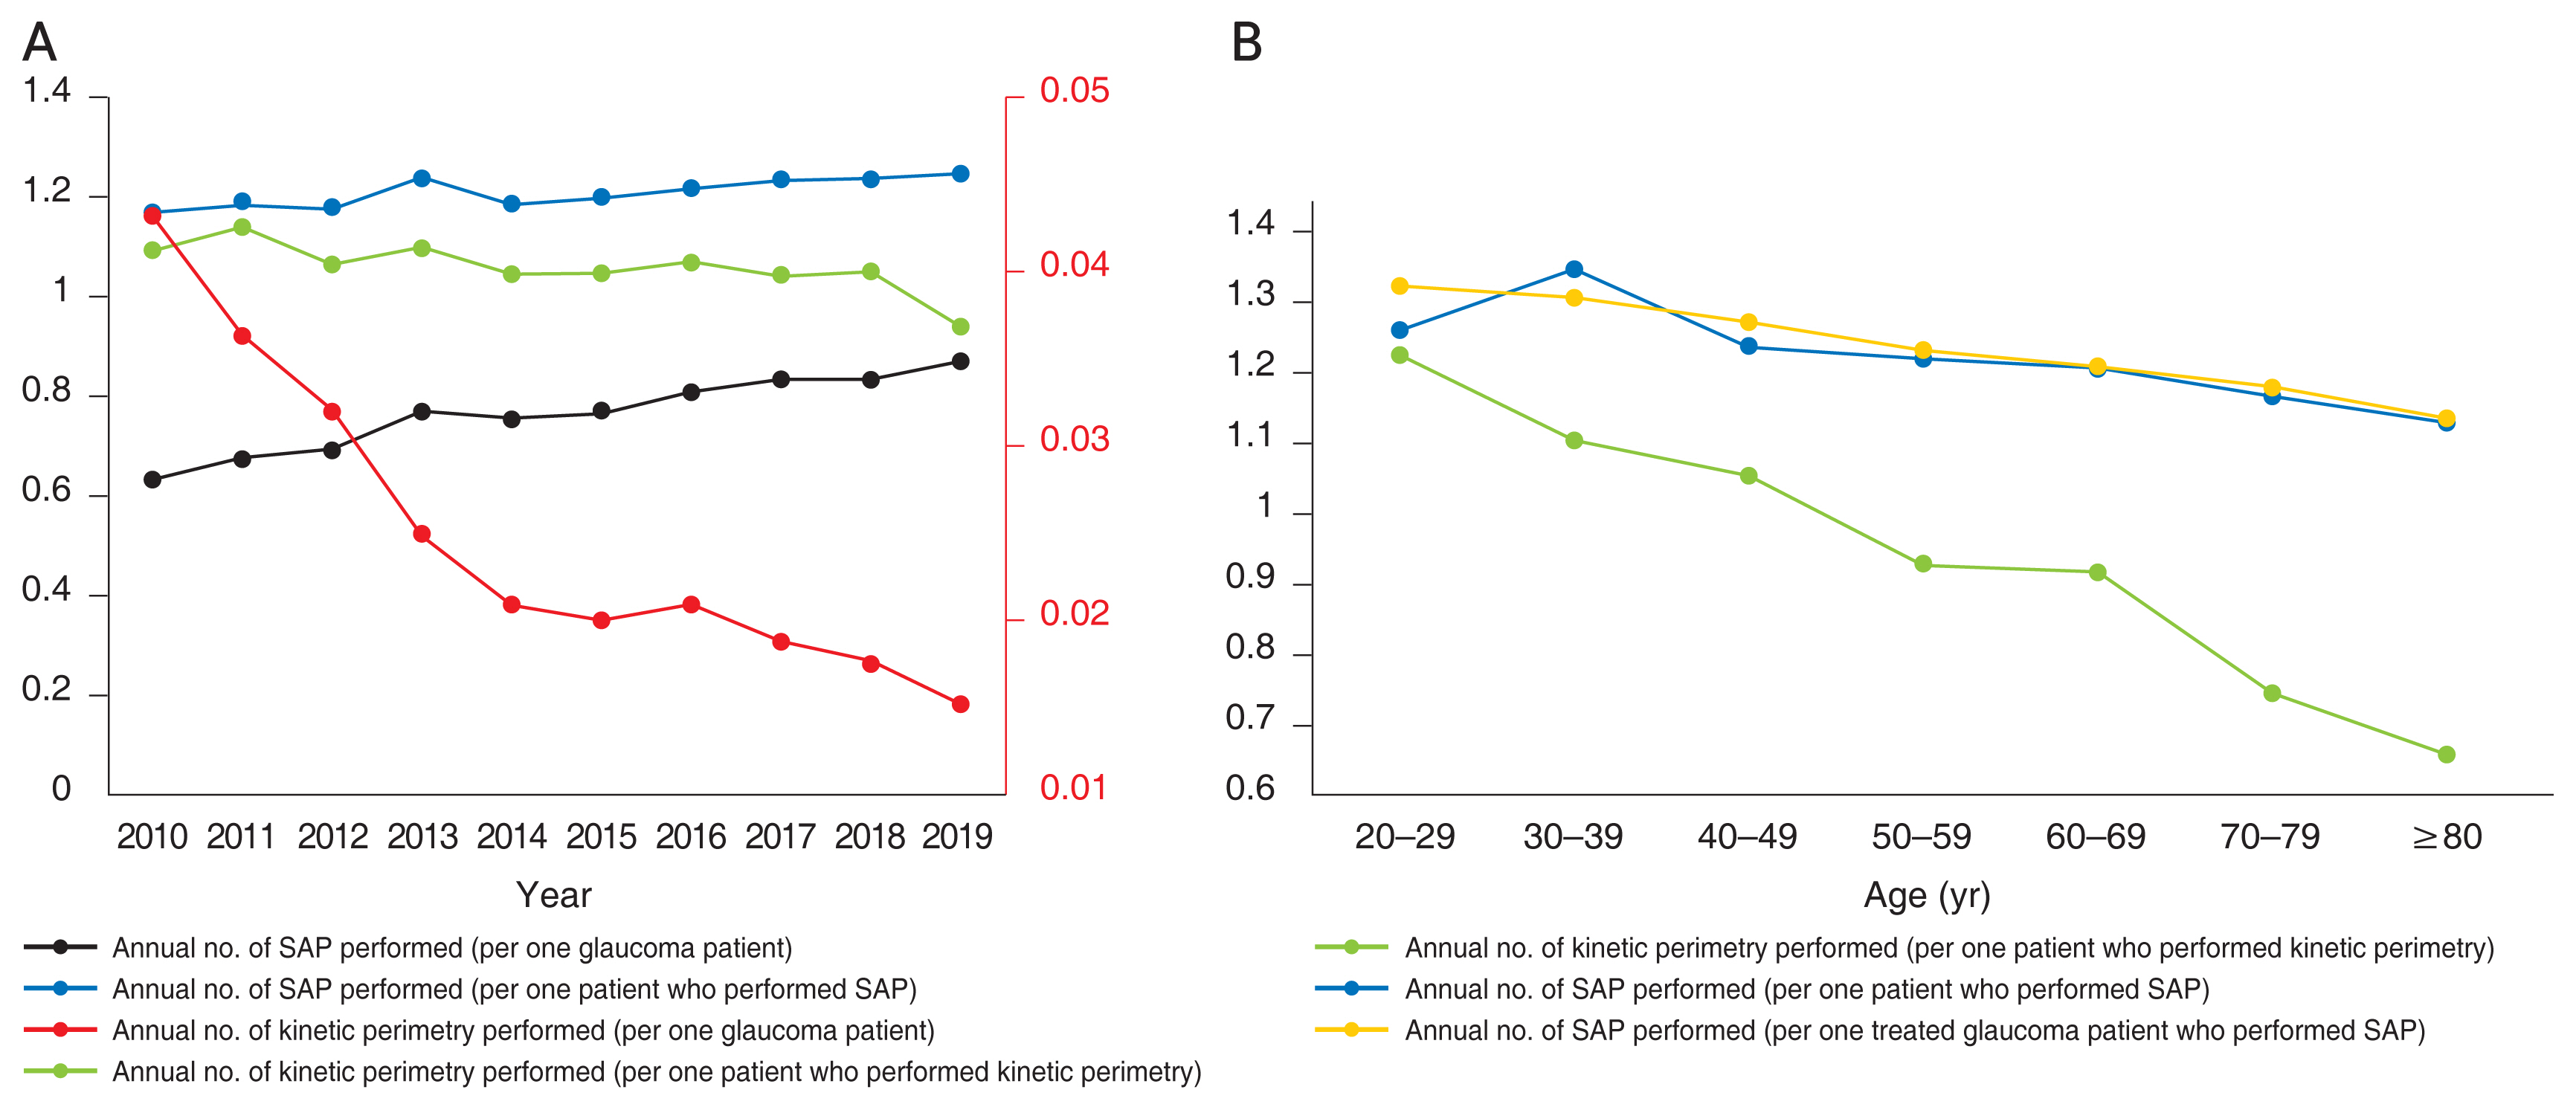
As for kinetic perimetry, the total number of examinations performed, in tertiary hospitals, for glaucoma or glaucoma-suspect patients decreased gradually, from 6,364 to 3,792 (Fig. 2A). Since the number of patients diagnosed with glaucoma increased significantly as presented above, the annual average for the number of kinetic perimetry performed per glaucoma patient significantly decreased (from 0.04 to 0.02, ╬▓ = ŌłÆ0.002, R2 = 0.638, p = 0.006). The average number of glaucoma or glaucoma-suspect patients on whom at least one kinetic perimetry also showed a decrease (Fig. 2B). Across the decade, there was an apparent and significant decrease in the annual average number of examinations performed per patient who underwent at least one kinetic perimetry (from 1.093 to 0.940, ╬▓ = ŌłÆ0.013, R2 = 0.580, p = 0.010) (Fig. 3A). Table 1 shows a detailed summary of the numbers of VF tests (i.e., SAP and kinetic perimetry) and of patients diagnosed as either glaucoma or glaucoma suspect over the course of the period from 2010 to 2019.
Trends of VF tests according to age groups
Table 2 summarizes the total numbers of SAP procedures performed on either glaucoma or glaucoma-suspect patients with respect to age (in 10-year age increments). The total number of SAP procedures was consistently the highest in the 50 to 59 years and 60 to 69 years age groups. The average number of SAP procedures per patient was smallest in the oldest age group (i.e., over 80 years; ╬▓ = ŌłÆ0.003, R2 = 0.747, p = 0.012) (Fig. 3B).
Trends of VF tests for treated glaucoma patients
To verify the SAP trends among treated glaucoma patients, we obtained information on any antiglaucoma medication prescription and glaucoma surgery history. Given that the HIRA drug-ingredient codes were revised in 2016, we analyzed the data only for 4 years, 2016 through 2019. Table 4 summarizes the total numbers of SAP procedures performed on treated glaucoma patients during that 4-year period. The count was consistently highest in the 60 to 69 years group (Fig. 4A, 4B). The annual average numbers of SAP procedures performed per patient showed similar trends between treated glaucoma and the entire glaucoma patients. The count significantly decreased with age (╬▓ = ŌłÆ0.003, R2 = 0.993, p < 0.001) (Fig. 3B).
Discussion
Between the years 2010 and 2019, the total number of SAP procedures and the annual average number of tests per person diagnosed with glaucoma or suspect gradually increased. Meanwhile, in terms of kinetic perimetry, the total and yearly average test number per patient decreased.
For identification of functional eye damage and overall management of glaucoma patients, VF testing remains an essential tool. It is clinically useful not only for diagnosis, but also for determination of treatment outcomes [11-15]. According to our present studyŌĆÖs results, the annual average number of SAP procedures performed per glaucoma patient in Korea increased; the average for the years 2016 and 2019 was 1.23 SAP procedures per year. Previous studies have investigated the connection between VF examination frequency and identification of clinically meaningful rates of change in glaucoma. It seems reasonable to posit that increased frequency of VF testing would lead to earlier detection of glaucoma progression. However, Wu et al. [16] found contradictory evidence that the increase of test number does not proportionally shorten the time necessary for detection of progression. Also, they suggested that two reliable tests at baseline, followed by semiannual testing, can be considered to be a reasonable compromise for both progression detection and minimization of health care resourcesŌĆÖ burden in clinical practice. It should be noted though, that the frequency as well as intervals of VF examination should also be guided by consideration of progression risk factors along with age and life expectancy [17].
The continuous increase in the number of patients on whom at least one SAP was performed indicates that more glaucoma or suspect patients are being monitored by SAP at tertiary hospitals. Even taking into account the increase in the total number of glaucoma patients, patients on whom SAP was performed at tertiary hospitals showed a greater increase. This might suggest that monitoring of disease progression in glaucoma or suspect patients at tertiary hospitals still depends on SAP despite the recent widespread use of imaging techniques such as OCT. One explanation for this increase might be patient referral to tertiary hospitals. In Korea, a substantial number of glaucoma patients, especially those at the moderate-to-advanced stage, are referred to tertiary hospitals, because most of the glaucoma subspecialists are concentrated in tertiary hospitals. Also, small hospitals may not have adequate facilities or technicians for VF examinations.
Notably, the annual average number of SAP performed per patient showed a statistically significant increase within the last decade. Despite the recent widespread use of imaging techniques such as OCT, SAP still seems to be valued for monitoring of disease progression in glaucoma or suspect patients at tertiary hospitals. However, cliniciansŌĆÖ glaucoma management patterns might differ between tertiary and smaller hospitals. It is possible that the use of SAP has decreased in smaller hospitals; thus, future studies should address the patterns of VF test utilization at smaller hospitals.
With regard to kinetic perimetry, the average test number per glaucoma or glaucoma-suspect patient decreased over the course of the decade of interest. The disadvantages of kinetic perimetry examination are its relatively long time and the susceptibility of its resultsŌĆÖ reliability to reductions up to 30% due to manual manipulation [18]. Every stimulus manipulation by the examiner affects how the patient will respond. Therefore, kinetic perimetry requires skilled technicians to obtain reliable results, and a lack of experienced technicians might be one of the reasons for the downtrend in testing. On the other hand, for SAP, a new tool and strategy known as the Swedish Interactive Threshold Algorithm (SITA), which includes SITA Standard, SITA Fast, and SITA SWAP (short-wavelength automated perimetry), has been developed. The SITA methods reduce testing time by half and offer good reproducibility as well as diagnostic performance. SITA Standard 24-2 testing can be run in as short a time as 4 minutes, and SITA Fast 24-2 testing can be as fast as 2 minutes [19-21]. Therefore, it is possible that this difference in ease of use in clinical settings caused the opposite trends in the utilization of SAP and kinetic perimetry.
The annual average number of SAP procedures and kinetic perimetry examinations per patient decreased significantly as patient age increased, which decline was shown to be greater in the case of kinetic perimetry. The reasons for the VF test number decrease with increasing age are not yet clear. VF examination is a subjective test that is greatly influenced by the reliability of patientsŌĆÖ cooperation [22] as well as the length of the testing time. As for the factors influencing VF test reliability, one of the major ones is patient age [23]. It is considered that for this reason, clinicians tend to order fewer VF tests for patients in older age groups; it also might explain why the decrease in the number of examinations by kinetic perimetry, which process is relatively time consuming, is larger among older patients. Severity of glaucomatous VF defect and test time also are known factors affecting VF test reliability. More severely depressed VF mean deviation and prolonged test time were found to be significant factors for low reliability indices (i.e., fixation loss, false-positive error, and false-negative error) [23]. Therefore, further research on how these factors affect the pattern of VF usage in accordance with age is needed.
When interpreting the present results, readers of this report should be mindful of several points. First, although we considered diagnostic codes along with drug/surgery codes in order to accurately select patients diagnosed with glaucoma, inaccurate diagnostic coding in the claims data remains a possibility. Also, we analyzed only 4 years of data for glaucoma drug usage, due to the 2016 drug-ingredient code changes. Second, we did not include patients who had been diagnosed as congenital glaucoma. It is possible that these patients had grown up into adulthood and underwent VF tests for monitoring of glaucoma progression. Although the annual number of adult patients diagnosed with code Q15 (including congenital glaucoma and other congenital malformations in eyes) was less than 500 per year between 2016 and 2019 according to the HIRA open database, future studies on VF trends should consider glaucoma codes assigned from a young age. Third, since the information we gathered was on VF examinations that had been performed in tertiary hospitals, our results cannot reflect the numbers of tests conducted in smaller hospitals. There are patients who are managed only in smaller hospitals or treated in both smaller and tertiary hospitals. Definitely, future research should address the patterns of VF tests performed on glaucoma or suspect patients at smaller hospitals. Fourth, the HIRA data unfortunately lack any detailed ophthalmic information, for example, glaucoma severity, progression rate, or other risk factors. Therefore, it was not possible for us to analyze the variation in the numbers of VF tests according to such clinical factors. Further investigations are needed in order to explore the clinical factors related to the use of VF examination in Korea and its trends. Fifth and finally, since the HIRA open database does not provide the exact data on whether a test was performed in one eye or in both eyes at a time, the current study estimated the trend of VF utilization under the assumption that all patients had VF tests in both eyes. We believe that this assumption did not have a significant impact on the overall trend of VF test utilization, provided that the number of patients undergoing unilateral tests from year to year does not fluctuate significantly. However, if there were many patients who had only one eye tested, the frequency of VF testing may have been underestimated.
In conclusion, between 2010 and 2019, the annual average number of SAP procedures performed per glaucoma or glaucoma-suspect patient showed a slight increase. Meanwhile, there was a significant decrease in the annual average number of kinetic perimetry examinations performed per patient. Future investigations are needed in order to explore in finer granularity the trends and clinical factors related to the use of VF examination in Korea.

 PDF Links
 PubReader
 ePub Link
 Full text via DOI
 Download Citation
 Supplement
 Print
Print