Myopic Open-angle Glaucoma Prevalence in Northeast Asia: A Systematic Review and Meta-analysis of Population-based Studies
Article information
Abstract
Purpose
Investigation of myopic open-angle glaucoma (OAG) prevalence in Northeast Asia by systematic review and meta-analysis.
Methods
Systematic PubMed, Embase and Cochrane database searches for Northeast Asian population-based studies published up to 30 November 2020 and reporting on myopia and OAG diagnosis. By random-effect models, pooled OAG prevalence in a myopic population and pooled myopic OAG prevalence in a general population were generated, with 95% confidence intervals (CIs).
Results
The meta-analysis encompassed five population-based studies in four countries (12,830 individuals, including 7,723 patients with myopia and 1,112 patients with OAG). In a myopic population, OAG prevalence was 4.10% (95% CI, 3.00–5.70; I2 = 93%); in a general population, myopic OAG prevalence was 1.10% (95% CI, 0.60–1.70; I2 = 94%). A visual examination of funnel plot symmetry raised a suspicion of publication bias. Notwithstanding, Begg and Mazumbar’s adjusted rank correlation test showed no such evidence (p = 0.6242).
Conclusions
Our systematic review and meta-analysis returned an estimate of OAG prevalence in a myopic Northeast Asian population. Our findings will inform future glaucoma studies as well as public health guidelines for Northeast Asian populations.
Myopia is an increasingly concerning public health issue, especially in East Asia, where it is already extremely widespread [1]. According to an estimate, the prevalence of myopia and high myopia worldwide will have increased by 2050 to nearly 5 billion and 1 billion people, respectively [2].
Glaucoma is the second leading cause of blindness globally, open-angle glaucoma (OAG) being its most common manifestation [3]. The most well-established OAG risk factor is myopia [4–7], the association between them having been exhaustively investigated.
However, whereas the respective prevalence of myopia and glaucoma are well-known, little is confirmed as to the prevalence of their combination. One study reported that 17.2% of Italian glaucoma patients were myopic [4]; other reports, meanwhile, have shown glaucoma proportions in myopic white populations ranging from 9% to 12% [8–10]. The prevalence of OAG in a myopic Asian population has yet to be investigated. In the present systematic review and meta-analysis, we investigated OAG prevalence in myopic Northeast Asian population and myopic OAG prevalence in a general Northeast Asian population.
Materials and Methods
Search strategy and selection criteria
The systematic review and meta-analysis were performed based on a pre-specified protocol, and their methods adhered to both the MOOSE (Meta-analyses Of Observational Studies in Epidemiology) [11] and PRISMA (Preferred Reporting Items for Systematic Reviews and Meta-Analyses) guidelines [12]. Research that consist of a meta-analysis are exempt from the need for institutional review board review [13].
We systematically searched for relevant studies in the PubMed, Embase, and Cochrane Library databases. Our strategies were developed with the assistance of an academic librarian with expertise in systematic review and were based on established terminology using MeSH and Embase search terms whenever available. The keywords included ‘glaucoma,’ ‘open-angle glaucoma,’ ‘myopia,’ ‘refractive error,’ and ‘prevalence.’ All of the search details are included in Table 1. Two investigators (YJ and AH) conducted the search in an independent and masked manner, and any inconsistencies were resolved by discussion and consensus, or if needed, by third-party (YKK) adjudication. We also manually reviewed the retrieved articles’ reference lists and identified additional relevant studies thereby. The databases were searched for any and all pertinent reports published through November 30, 2020.
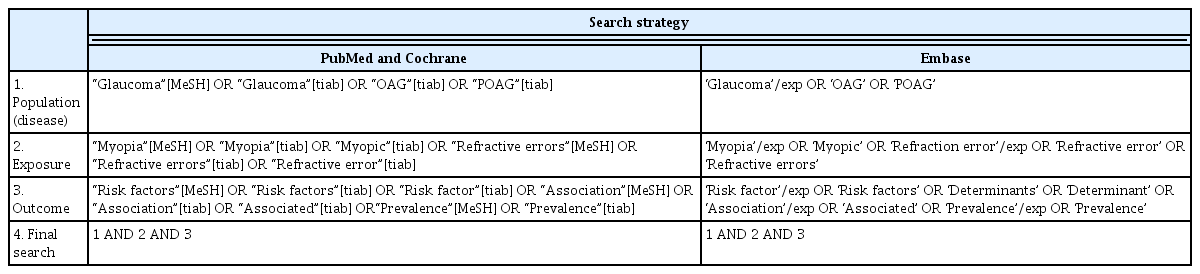
PubMed, Cochrane, and Embase search strategy
Study selection
In the systematic review, the study inclusion criteria were as follows: (1) population-based and (2) evaluation of both OAG and myopia prevalence. The exclusion criteria were as follows: (1) not conducted with humans or adults, (2) narrative and/or systematic review, commentary, case report, (3) involving either secondary glaucoma or angle-closure glaucoma, (4) not conducted in Northeast Asia, (5) published in language other than English, and (6) lacking any detailed definition of OAG.
Data extraction and quality assessment
Two investigators (YJ and AH) extracted data in both an independent and masked fashion using a standardized data extraction method based on those employed by the Cochrane Library’s Database of Systematic Reviews (The Cochrane Collaboration: Review Manager 4.1.1. Nepean, Ontario, Canada). Extracted data following entry into a dedicated database were rechecked by a third investigator (YKK). The following data were extracted: first author’s name, publication year, race/ethnicity of population, study country, subject number, subjects’ age and sex, OAG-diagnostic criteria, myopia definition followed, OAG patient number, myopia patient number, and number of patients with both myopia and OAG.
To assess the methodological quality of the studies, the Newcastle-Ottawa Scale for assessment of comparative nonrandomized study quality was applied (Table 2) [19–23]. Studies were additionally evaluated to determine the risks of bias related to selection, comparability, exposure/outcome, or any other factor.

Quality assessment of included studies according to the Newcastle-Ottawa Scale
Statistical analysis
Because of the anticipated high levels of heterogeneity, we used a random effect model to estimate the pooled OAG prevalence in a myopic population and the pooled myopic OAG prevalence in a general population. Inter-study heterogeneity was quantified by the I2 statistic representing the interstudy variation prevalence that can be attributed to heterogeneity rather than sampling error [14,15]. Values of approximately 25%, 50%, and 75% represent low, medium, and high heterogeneity, respectively.
To qualitatively synthesize myopia degree, the prevalence of myopic OAG, and percentage of OAG among myopia, we stratified myopia into low, moderate, moderate-to-high, and high degree categories, as based on spherical equivalent (SE) refractive error up to −3 diopters (D), between −6 D and −3 D (or −4 D), lower than −3 D (or −4 D), and lower than −6 D, respectively.
Publication bias was evaluated in two ways: (1) qualitatively by funnel plot [16], recognized as the best way to determine if small studies with small effect sizes are missing, and (2) quantitatively by Begg and Mazumdar’s adjusted rank correlation test (a direct statistical analogue of the funnel plot), which determines if there is any significant correlation between effect estimates and their variances [17]. The absence of same would suggest unbiased study selection.
The data handling and the statistical analyses were under the purview of a single investigator (YKK) supervised by a statistician with expertise in meta-analysis (SRS). All of the 95% confidence intervals (CIs) and p values were two-sided; p < 0.05 was considered to represent statistical significance. All of the statistical analyses were performed with R ver. 4.0.4 (The R Foundation for Statistical Computing, Vienna, Austria; https://www.r-project.org/) [17,18].
Results
Study inclusion
Our systematic search identified 1,014 articles, 765 from PubMed and 249 from Embase (not in PubMed), among which, 79 were full-text reviewed. Following a thorough review, the final analysis proceeded with five studies (Fig. 1).
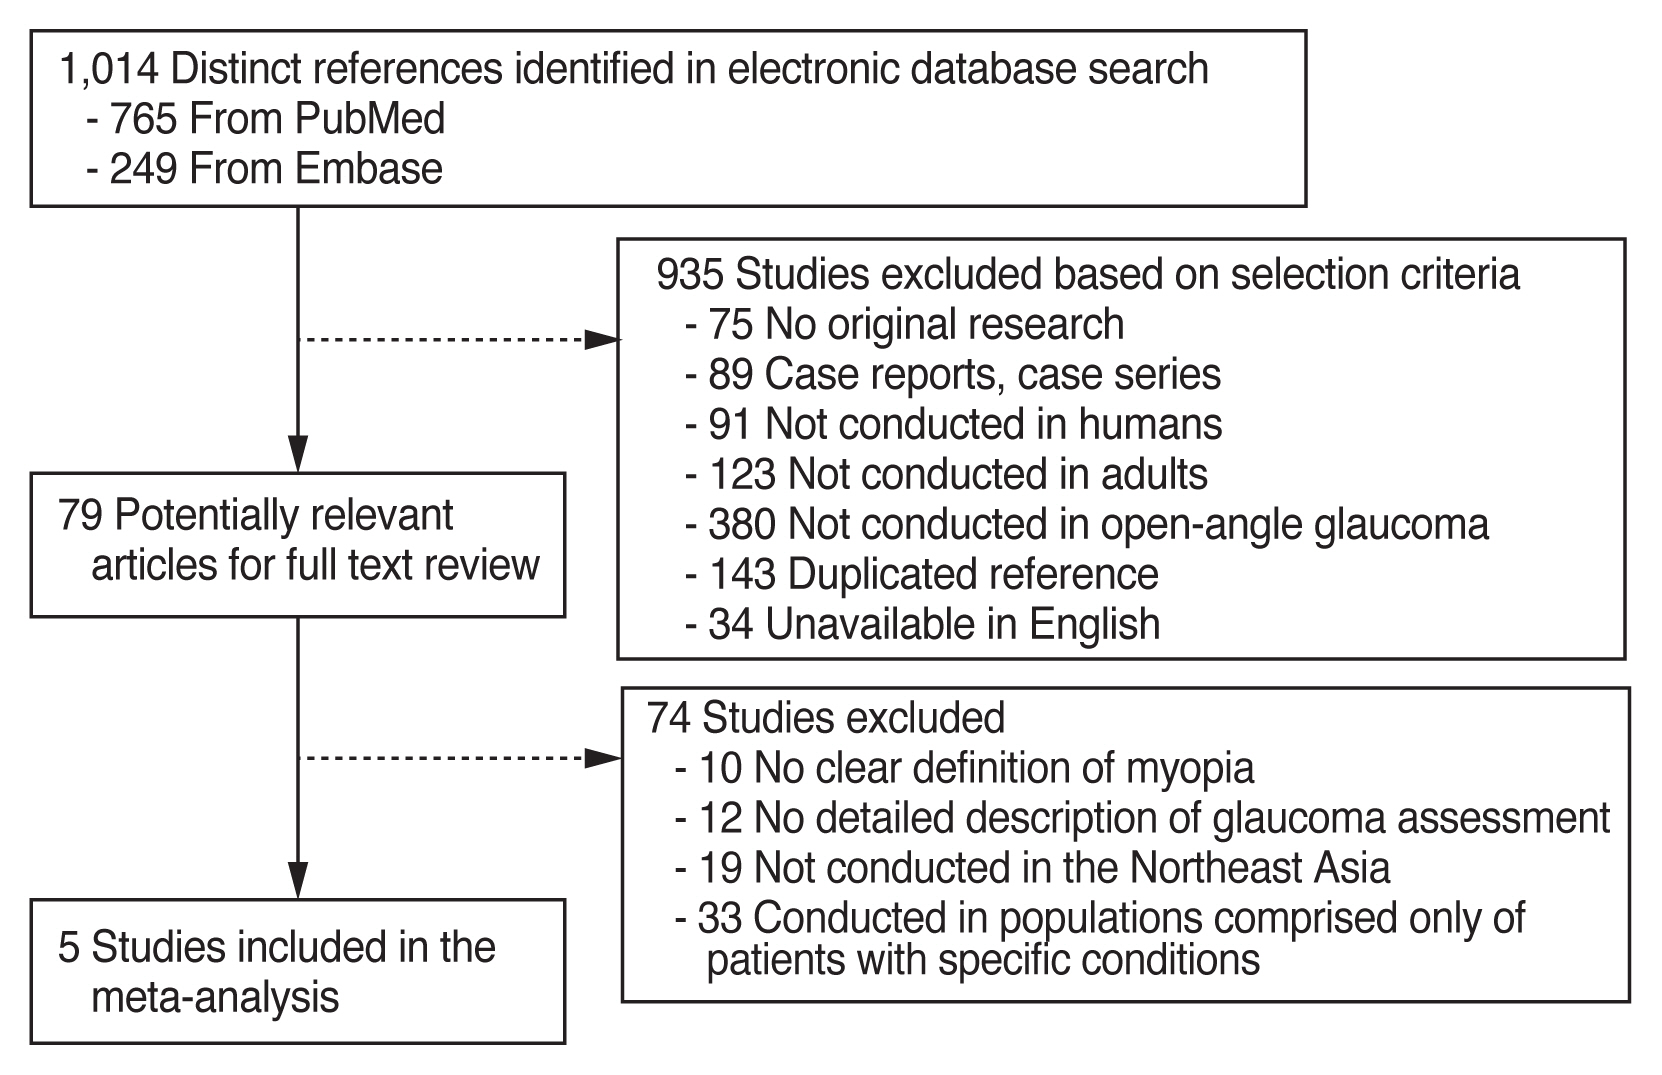
Flow diagram showing study selection process for meta-analysis.
Five population-based studies involving a total of 26,661 individuals had been conducted in four countries: two in China [19,20], one in Japan [21], one in South Korea [22], and one in Singapore (Malay population) [23]. The number of participants varied from 2,528 to 13,831; the median sample size was 3,108. The mean age in each study was 55.8 ± 10.3 years in Beijing, China; 63.5 ± 8.8 years in Shanghai, China; 58.4 ± 11.8 years in Japan; 55.1 ± 0.2 years in South Korea; and 58.2 ± 10.9 years in Singapore (Malay population). In three of the studies, myopia was defined according to an SE of −0.5 D [20,22,23], and one study reported myopia of less than −1.0 D SE [21]. One other study provided no definition of myopia [19].
In the South Korean study, the number of OAG patients was 710, the highest among the studies. In the Chinese, Japanese, and Singaporean (Malay population) studies, the OAG patient numbers ranged between 72 and 119. The number of myopic patients, like the number of OAG patients, was highest in South Korea (4,039), followed by Beijing, China (1,837). The myopic patient numbers in the three remaining studies ranged between 239 and 877. Table 3 summarizes the characteristics of all of the studies [19–23]. Table 4 lists the diagnostic criteria for glaucoma followed in each study [19–23].

Characteristics of studies included in the meta-analysis
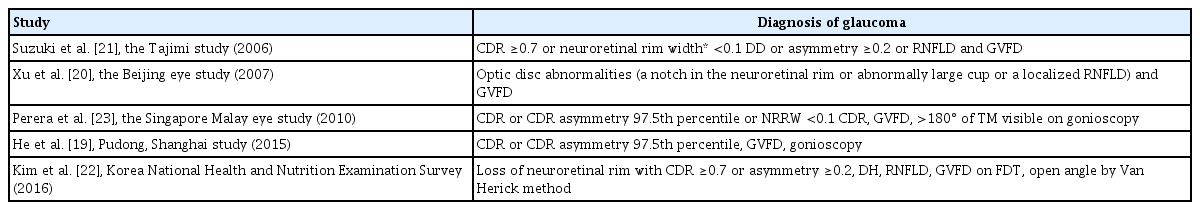
Glaucoma diagnostic criteria for studies included in the meta-analysis
Estimated prevalence of myopic OAG in Northeast Asian population
In the Northeast Asian population as a whole, the estimated prevalence of myopia ranged from 9.5% to 42.5%, and that of OAG ranged from 2.8% to 5.1% (Table 3) [19–23]. The estimated OAG prevalence among myopia patients ranged from 2.7% to 6.3%. In South Korea, the prevalence was 6.3%, the highest among the studies. The prevalence was the lowest in China (2.7%). In the general population, the prevalence of myopic OAG ranged from 0.5% to 1.8% (Table 3) [19–23]. The estimated prevalence was 1.8% in South Korea and 0.5% in China, the highest and the lowest, respectively. In the other three studies, the estimated prevalence of myopic OAG ranged between 0.7% and 1.5%. The detailed results are provided in bar graphs in Fig. 2.

Bar graphs showing prevalences of myopia, open-angle glaucoma (OAG), myopic OAG, and OAG among myopic patients.
Pooled prevalence of myopic OAG and OAG in myopia
The overall pooled prevalence of OAG among patients with myopia was 4.10% (95% CI, 3.00%–5.70%). There was significant heterogeneity of OAG prevalence in myopia (I2 = 90%, p < 0.01) (Fig. 3A). The overall pooled myopic OAG prevalence in the general population was 1.1% (95% CI, 0.6%–2.1%). The pooled estimate of overall myopic OAG showed substantial heterogeneity as well (I2 = 94%, p < 0.01) (Fig. 3B).
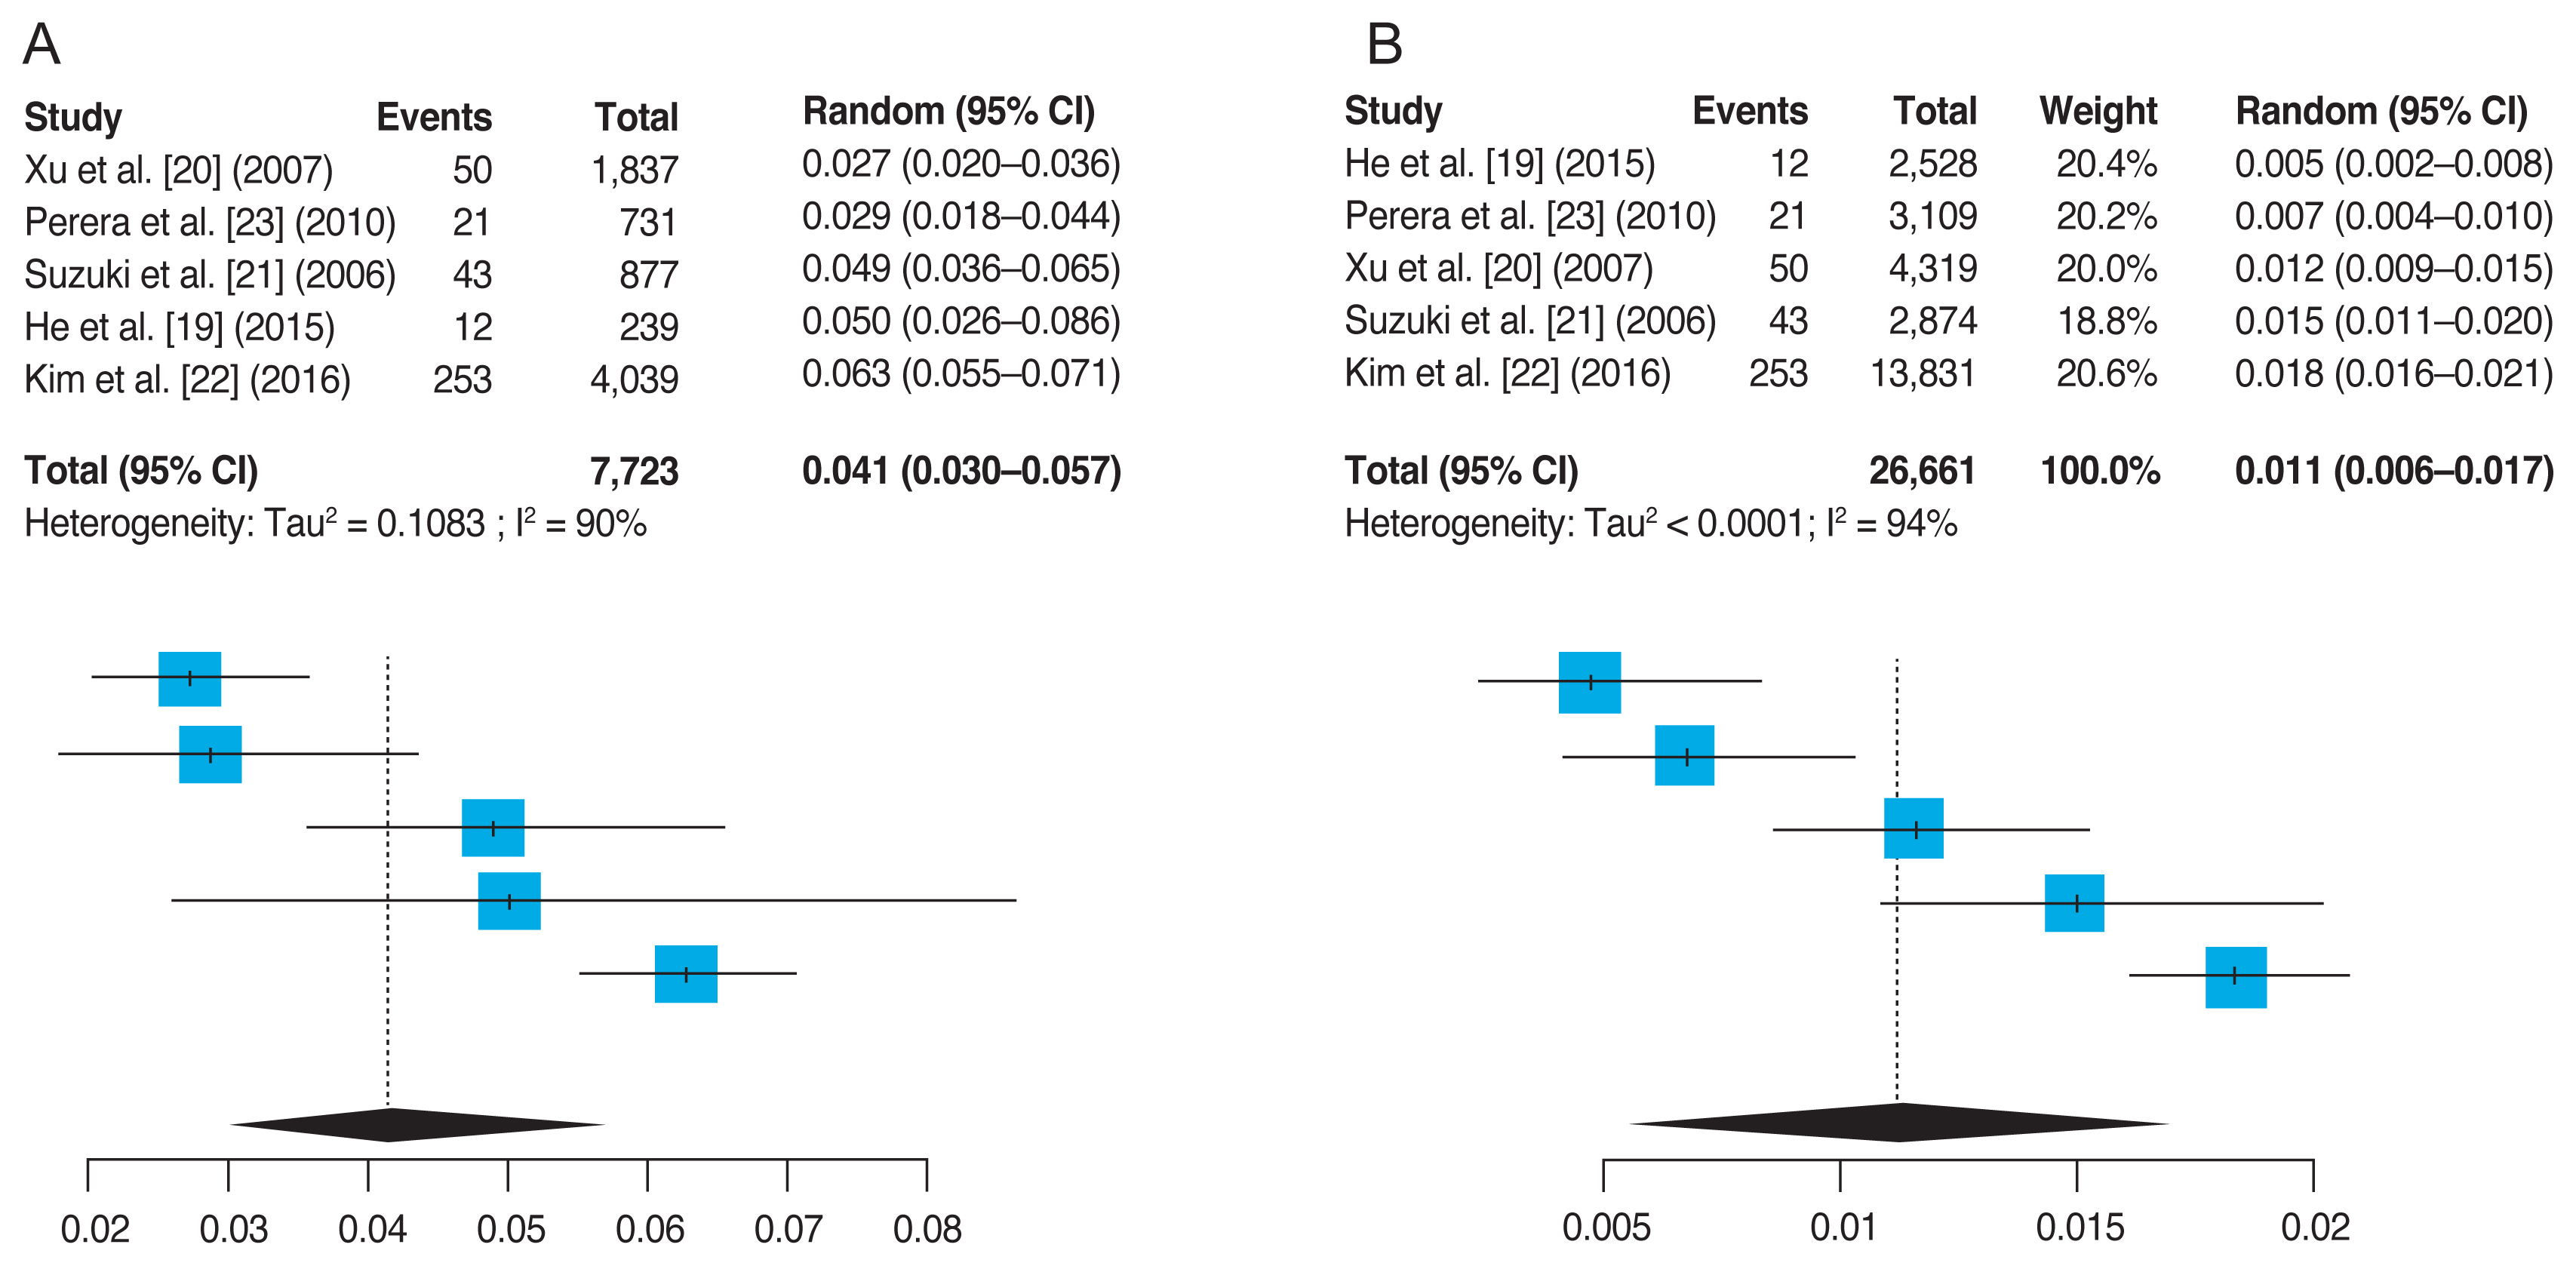
Forest plot of (A) overall pooled percentage of open angle glaucoma among patients with myopia and (B) overall pooled prevalence of myopic open angle glaucoma. CI = confidence interval.
Qualitative synthesis of OAG prevalence by myopia severity
Four studies (except He et al. [19], Pudong, Shanghai Pudong, Shanghai study) reported both an odds ratio (OR) for any myopia and ORs by myopia severity. Table 5 shows the prevalence of OAG by myopia severity in general Northeast Asian population and percentage of OAG by myopia severity in myopic population of Northeast Asia [20–23]. The prevalence of highly myopic OAG in general population was 0.15% to 0.16%, that of moderately myopic OAG was 0.12% to 0.9%, and that of mildly myopic OAG was 0.32% to 1.63%. The percentage of OAG among patients with low myopia, moderate-to-high myopia, and high myopia was 2.24% to 4.37%, 2.40% to 5.33%, and 6.07% to 8.68%, respectively.
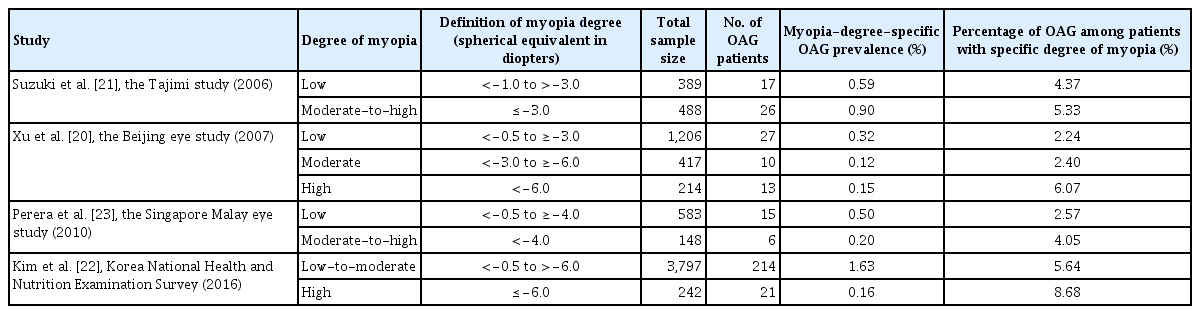
Characteristics of studies included in the meta-analysis according to the degree of myopia
Publication bias
Fig. 4 shows the present study’s funnel plots for indications of publication bias. According to our meta-analysis for the pooled prevalence of OAG among patients with myopia (Fig. 4A) and for overall pooled myopic OAG prevalence in the general population (Fig. 4B), two studies and one study were distributed on the outer left and right sides of the funnel, respectively. Inside the funnel, two studies were distributed to the right. According to this visual depiction of plot symmetry, therefore, publication bias was suspicious. However, Begg and Mazumbar’s adjusted rank correlation test showed no evidence of publication bias (p = 0.62). Even in our meta-analysis of the pooled prevalence of myopic OAG in the general population, no publication bias was found (Begg and Mazumbar’s adjusted rank correlation test, p = 0.57).
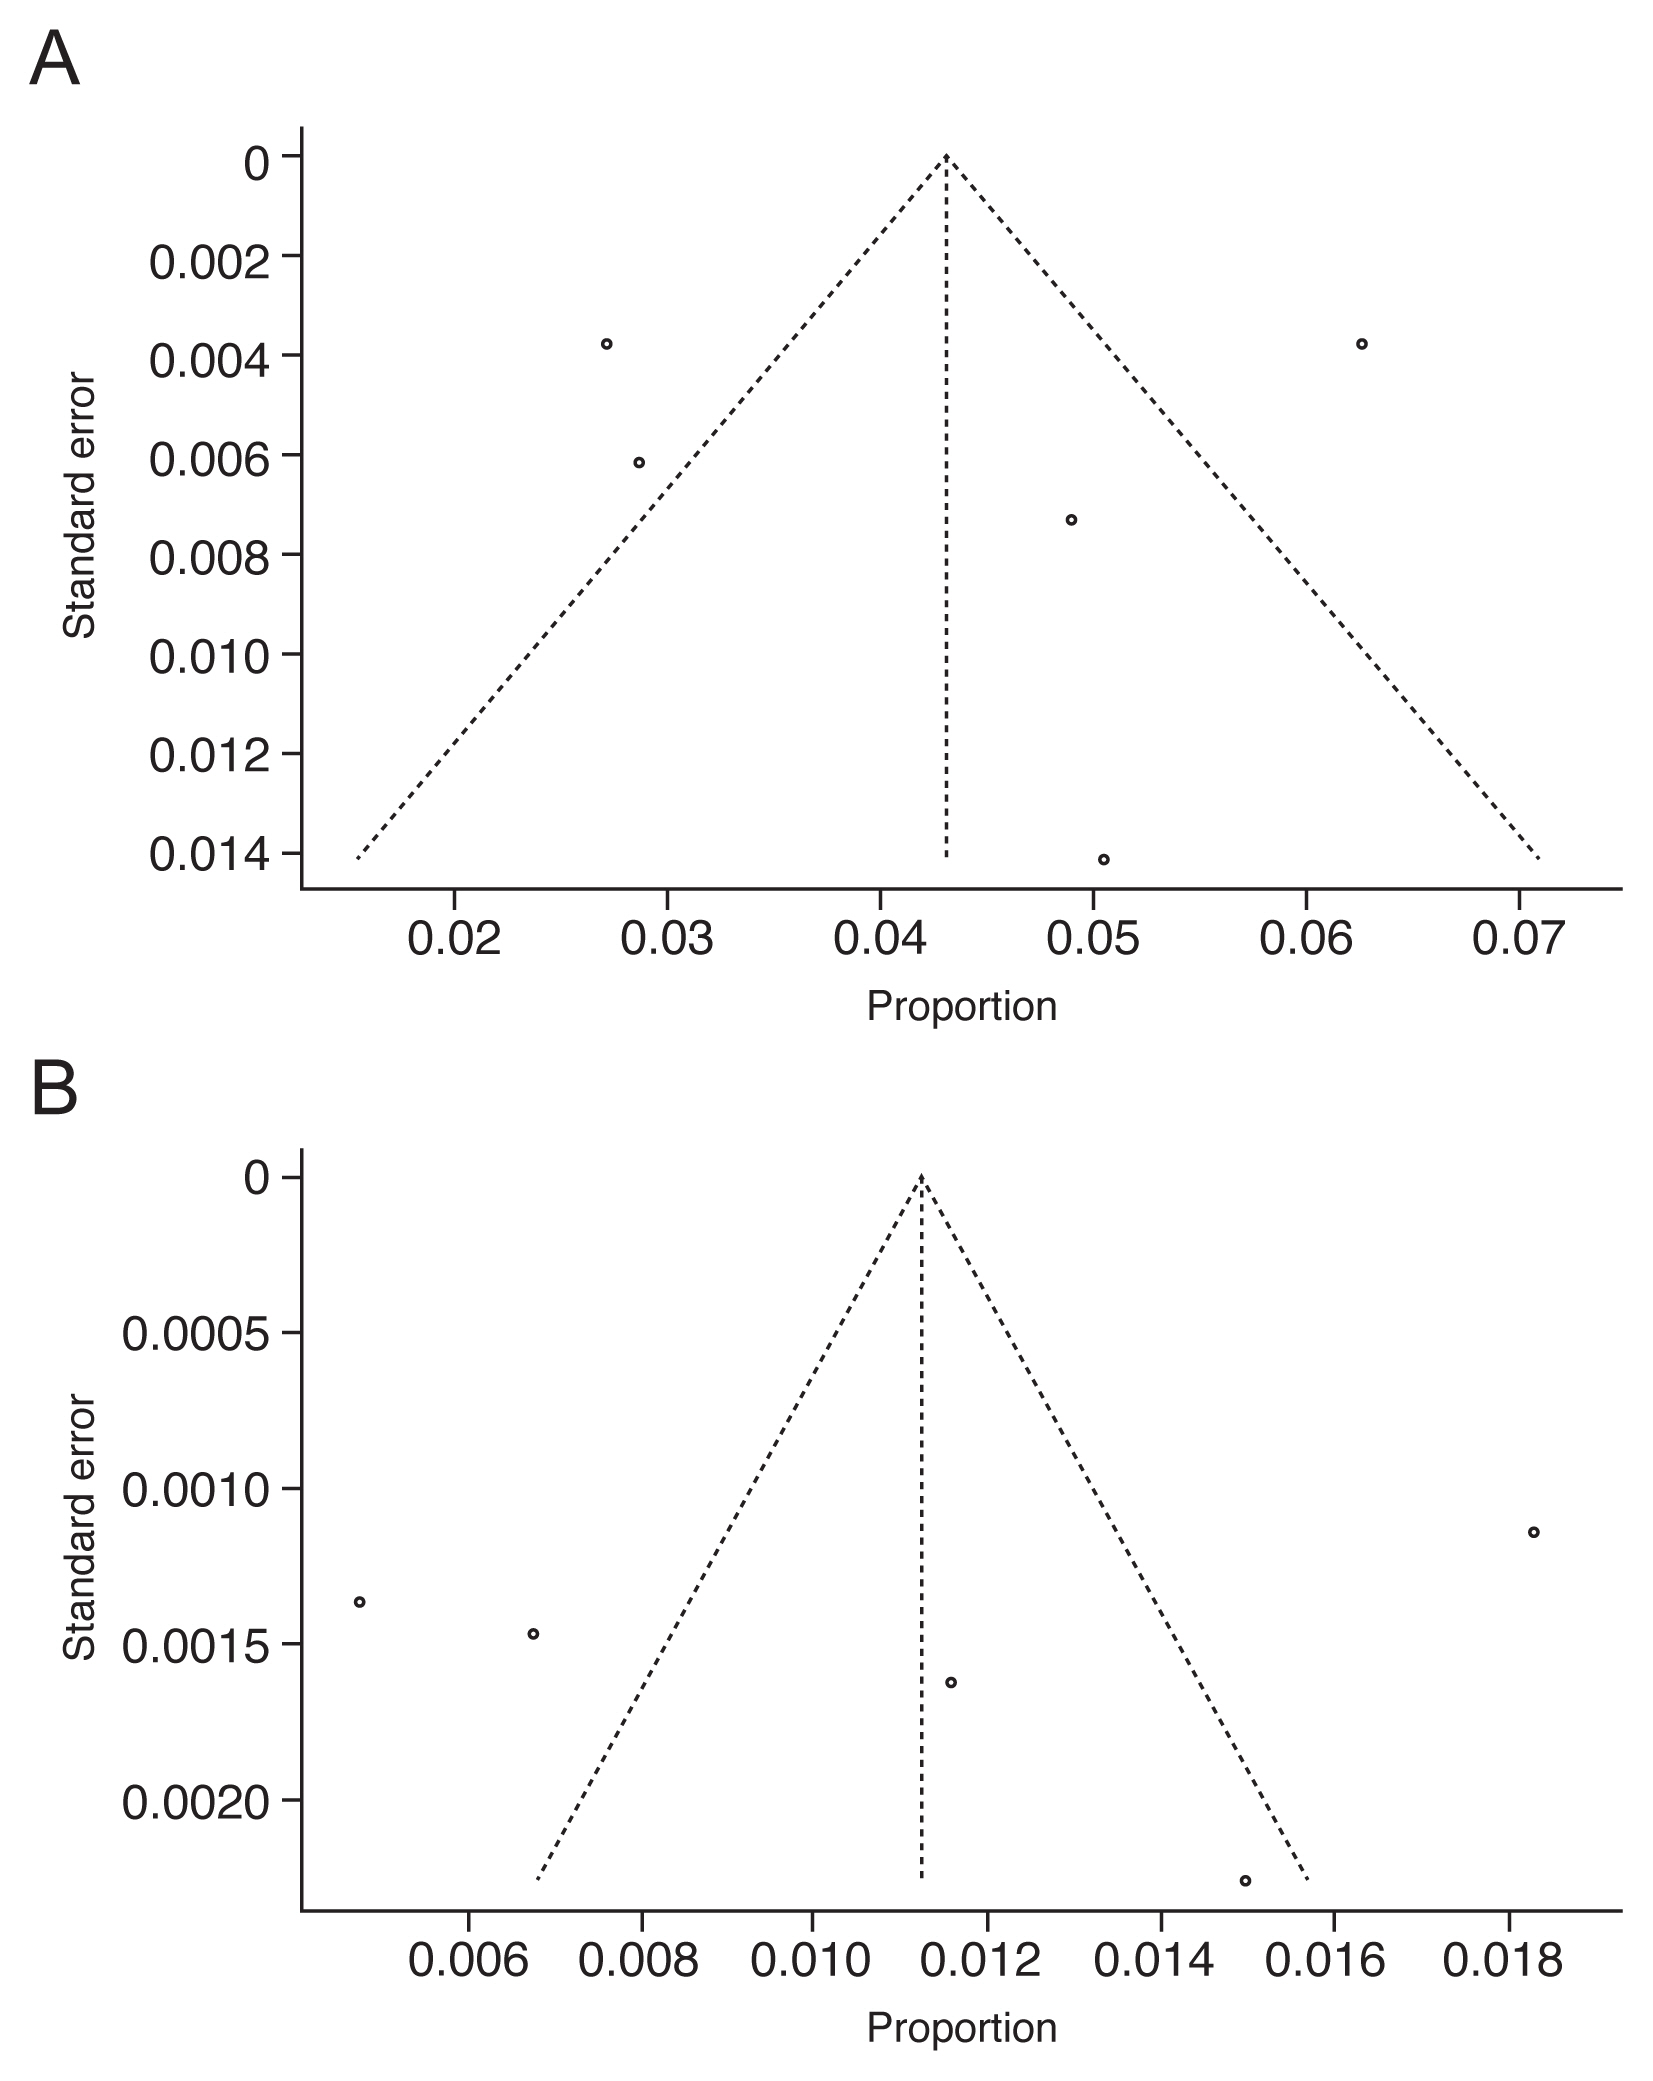
A funnel plot for meta-analysis of (A) overall pooled percentage of open angle glaucoma among patients with myopia and (B) overall pooled prevalence of myopic open angle glaucoma.
Discussion
Myopia has become a major health concern in East Asia [24]. Previous studies have shown similar Japanese and Chinese myopia prevalence to those in other Asian surveys but higher ones than those among white or black populations [25,26]. Glaucoma is the second leading cause of blindness globally [27]. Myopia is a well-known, independent risk factor for OAG [4–6], and certainly, the association between them is a long-standing research interest.
To the best of our knowledge, this is the first meta-analysis of myopic OAG prevalence and OAG prevalence in myopic Asian populations. This study involved a total of 12,830 subjects, among whom were 7,723 patients with myopia and 1,112 with OAG. The pooled OAG prevalence among those with myopia was 4.1%, and the pooled myopic OAG prevalence in the general population was 1.1%.
Within Northeast Asian populations, there has been significant variability in the prevalence of myopic OAG and the proportion of OAG patients among myopia sufferers. Our current results showed that the prevalence of myopic OAG and OAG among myopic patients were the highest in the South Korean population (1.8% and 6.3%, respectively). As for the other countries, the prevalence of myopic OAG were 1.5% in Japan, 0.5% to 1.2% in China, and 0.7% in Singapore (Malay population); the prevalence of OAG among myopia patients, meanwhile, were 2.7% to 5.0% in China, 4.9% in Japan, and 2.9% in Singapore (Malay population).
The percentage of OAG among patients with low myopia was 2.24% to 4.37%, while that with high myopia was 6.07% to 8.68%. Pan et al. [28] showed that eyes with high myopia had six-fold greater odds of having primary OAG. Although meta-analysis of pooled ORs for glaucoma for different myopia degree was not possible due to insufficient number of studies, such trend of higher percentage of OAG in highly myopic patients agreed with the study by Pan et al. [28].
There is no single conclusion about the influence of ethnicity on refractive error and glaucoma. The effect of refractive error on the risk of primary open-angle glaucoma (POAG) was modestly but significantly stronger in non-Hispanic whites, and its effect on the risk of normal-tension glaucoma was significantly stronger in Asians and non-Hispanic whites [29]. It was also previously suggested that myopia is significant risk factor for POAG among Asians than in white and black populations [20,23,30–35]. In fact, Rudnicka et al. [36] suggested that certain ethnic groups (East Asians) seemed more susceptible to myopia when exposed to the same environmental risk factors for myopia. Our analysis, however, showed that the percentage of OAG among myopic Asian patients (2.7%–6.3%) was similar to those reported for white populations (2.9%–8.1%) [37,38]. It is interesting that the percentage of OAG among myopia was similar between East Asians and Western Europeans, while the prevalence of myopia is remarkably high among East Asian populations (40%–70.6%) compared to that of United States (25.4%) or Western Europe (26.6%) [38–41]. Whether such results imply that myopic white patients are more susceptible to develop OAG cannot be concluded. Further research involving more qualified studies from multiple countries, ethnicities and continents should be conducted for more generalized conclusions regarding any ethnic predisposition to myopic OAG.
There are several limitations to the present meta-analysis that need to be acknowledged. First, there was substantial heterogeneity among the studies, which may have resulted from differences in study designs, populations targeted, analysis strategies, and characteristics of participants. The real effects in particular studies may be significantly different from our estimate of overall effect. Rucker et al. [42] mention that baseline or design-related heterogeneity occurs when the population or research design of studies differs between the studies. Five studies included in our study were composed of variable populations in which some only dealt with urban population. The prevalence of normal intraocular pressure in patients with POAG differed by the studies. For example, the prevalence of normal intraocular pressure among POAG patients in Korean population was 95.5%, whereas that in Shanghai population was 70%. Such variation in study population may lead to significant level of heterogeneity in our study. Second, the ways in which the patients had been diagnosed with myopia and OAG differed as well, and as such, some diagnostic bias might have been operative. Third, the major drawback of meta-analyses of studies in general is publication bias. Publication bias might be an issue, because studies that report statistically significant results are more likely to get published than are those that report nonsignificant results, which could have distorted our meta-analysis findings [43]. However, Begg and Mazumbar’s adjusted rank correlation test suggested that there was no evidence of publication bias in our study. Fourth, evaluation of glaucomatous structural change in the optic nerve head can be challenging in myopic eyes owing to morphologic characteristics such as tilted disc, peripapillary atrophy, and larger diameters of optic disc [44,45]. Non-glaucomatous optic nerve damage also can accompany high myopia [46]. Thus, it needs to be kept in mind that overdiagnosis of glaucoma in myopic eyes might result in overestimation of the prevalence of glaucoma in a myopic population.
In conclusion, we estimated the prevalence of OAG in a myopic Northeast Asian population and the prevalence of myopic OAG in a general Northeast Asian population. Our findings will inform future glaucoma studies as well as public health guidelines for Northeast Asian populations.
Notes
Conflicts of Interest
No potential conflict of interest relevant to this article was reported.
Funding
The authors received no financial support for this article.
Acknowledgements
None.