Clinical Predictors of the Region of First Structural Progression in Early Normal-tension Glaucoma
Article information
Abstract
Purpose
This study aimed to compare the clinical characteristics of patients who showed structural progression in the peripapillary retinal nerve fiber layer (RNFL) first against those who showed progression in the macular ganglion cell-inner plexiform layer (GCIPL) first and to investigate clinical parameters that help determine whether a patient exhibits RNFL or GCIPL damage first.
Methods
A retrospective review of medical records of patients diagnosed with early-stage normal-tension glaucoma was performed. All eyes underwent intraocular pressure measurement with Goldmann applanation tonometer, standard automated perimetry, and Cirrus optical coherence tomography at 6-month intervals. Structural progression was determined using the Guided Progression Analysis software. Blood pressure was measured at each visit.
Results
Forty-one eyes of 41 patients (mean age, 52.6 ± 16.7 years) were included in the study. In 21 eyes, structural progression was first detected in the RNFL at 54.2 ± 14.8 months, while structural progression was first observed at the macular GCIPL at 40.5 ± 11.0 months in 20 eyes. The mean intraocular pressure following treatment was 13.1 ± 1.8 mmHg for the RNFL progression first group and 13.4 ± 1.8 mmHg for the GCIPL progression first group (p = 0.514). The GCIPL progression first group was older (p = 0.008) and had thinner RNFL at baseline (p = 0.001). The logistic regression analyses indicated that both age and follow-up duration until first progression predicted the region of structural progression (odds ratio, 1.051; 95% confidence interval, 1.001–1.105; p = 0.046 for age; odds ratio, 0.912; 95% confidence interval, 0.840–0.991; p = 0.029 for time until progression).
Conclusions
Age of glaucoma patients and time until progression are associated with the region of the first structural progression in normal-tension glaucoma. Further studies exploring the association between glaucomatous progression and the location of damage are needed.
Normal-tension glaucoma (NTG) is characterized by the chronic degeneration of retinal ganglion cells (RGCs). The longitudinal examination of the disease broadly consists of the structural evaluation of the optic nerve head and surrounding retinal nerve fiber layer (RNFL) and the functional evaluation of the visual field (VF). For monitoring of structural damage, spectral-domain optical coherence tomography (OCT) has become an integral component [1]. This noninvasive imaging modality provides quantitative analyses of the peripapillary RNFL thickness with high sensitivity and reproducibility [2]. However, the RNFL analysis has shown limited usefulness in advanced glaucoma as it reaches the measurement floor [34].
In 1998, Zeimer et al. [5] first proposed that changes in retinal thickness at the macula may be an indicator of the structural damage in NTG based on the anatomic evidence that almost half of the RGCs are aggregated in the macular region. Since then, many studies have put the macular analysis to the test [678]. Current evidences so far suggest that not only is assessing the ganglion cell-inner plexiform layer (GCIPL) at the macula a reliable alternative to measuring peripapillary RNFL thickness in advanced stages of the disease [9], but it is also an effective indicator of structural damage progression in early stages [1011]. In fact, reports of patients showing signs of ganglion cell damage at the macula first instead of the peripapillary RNFL are mounting [1213].
However, no studies to date have extensively characterized and compared patients that dominantly show their first progression at the peripapillary RNFL against those who show damage at the macular GCIPL first. In light of the above, this study sought to identify clinical parameters associated with the region of the first structural progression in NTG.
Materials and Methods
Study population
A retrospective, prerecruitment chart review of patients who visited the glaucoma clinic at Severance Hospital was conducted. Among 140 patients who received a diagnosis of NTG between January 2010 and August 2019, patients who were older than 20 years of age were considered eligible for inclusion in this study. A diagnosis of NTG was made when glaucomatous optic disc changes (i.e., localized or diffuse neuroretinal rim thinning or a difference in the cup-to-disc ratio greater than 0.2 between two eyes) were identified on stereo-disc photographs and the presence of RNFL defect was noted on either red-free fundus photos or Cirrus OCT (Carl Zeiss AG, Oberkochen, Germany). The presence of glaucomatous VF defects was not required for diagnosis. The following exclusion criteria were applied for the final selection of the study population: (1) any history of ocular surgery other than uncomplicated cataract surgery, (2) history of other ocular disease that may increase intraocular pressure (IOP) and cause secondary glaucoma, (3) systemic ocular pathology known to affect the optic disc, (4) moderate to advanced glaucoma (lowest mean deviation worse than −6 dB by field analyzer measurement), (5) less than 6 high signal strength (>6 / 10) Cirrus OCT tests, (6) failure to undergo two consecutive reliable baseline VF examinations (a reliable VF test w as defined as fixation loss ≤33%, false-negative rate ≤33%, and false-positive rate ≤15%), a nd (7) a bsence of the demonstration of structural damage progression at any region during Cirrus OCT testing during follow-up. When both eyes of a single patient were eligible for inclusion, one eye was chosen at random. Patients with preperimetric glaucoma showing glaucomatous optic neuropathy in the absence of corresponding VF defects as well as early-stage glaucoma with glaucomatous optic neuropathy, corresponding VF defects and the mean deviation less than −6 dB were recruited. Finally, a total of 41 eyes were included in this study.
The study protocol adhered to the tenets of the Declaration of Helsinki and was approved by the institutional review board of the Severance Hospital at Yonsei University College of Medicine (4-2019-0835). All participants provided written informed consent after receiving an explanation about the nature and consequences of the study.
Ophthalmologic evaluation
All patients underwent complete ophthalmologic examinations at their initial visit. A review of the underlying medical history and measurements of visual acuity, refraction error, and central corneal thickness were performed. Slit-lamp examinations, gonioscopy and dilated fundus examination with a 90D lens were also conducted. IOP was measured with a Goldmann applanation tonometer (Haag-Streit model BQ-900; Haag-Streit, Bern, Switzerland). The initial examination also included color disc stereophotography, red-free fundus photography, standard automated perimetry (24-2 SITA standard, Humphrey Field Analyzer II; Carl Zeiss AG, Oberkochen, Germany) and Cirrus OCT. After diagnosis, patients were followed every 6 months. For each visit, patients underwent assessments of visual acuity, IOP, slit-lamp biomicroscopy, stereoscopic optic-disc photography, VF test, red-free fundus photography, Cirrus OCT, and systemic blood pressure measurement. Maximum and minimum blood pressures were recorded for each patient; the fluctuation in blood pressure was taken as the standard deviation of all blood pressures measured during follow-up.
The average IOP from three repeated measurements during separate follow-up visits were averaged and recorded as the baseline IOP. The percentage of reduction was defined as the difference between the baseline IOP and the mean IOP divided by the baseline IOP. The standard deviation of all IOP measurements collected during follow-up was considered to be the IOP fluctuation. The percentage difference at the time of structural progression was taken to be the value obtained by subtracting the IOP at the time of progression from the mean IOP and dividing that value by the mean IOP. By masked assessment of optic-disc stereophotographs, optic-disc hemorrhage was detected when a sign of hemorrhage was found within one disc-diameter of the optic disc border without any association with optic-disc edema, papillitis, diabetic retinopathy, or retinal vein occlusion.
Determination of structural progression
The structural progression was determined using the Guided Progression Analysis of Cirrus OCT ver. 6.0 software (Carl Zeiss AG). In short, the algorithm aligns superpixels (4 × 4 pixels) and measures the thickness at each superpixel. The initial two examinations were set as the baseline and changes at individual superpixels from the baseline through follow-up were noted. The trend-based progression analysis uses the aligned images and performs linear regression analyses between the change in the thickness at each superpixel and the follow-up time. When a significant trend is noted in 20 contiguous superpixels in the linear regression, the change is marked as a significant progression. The rate of change at either the peripapillary RNFL or macular GCIPL was recorded. The event analysis marks a data point yellow to indicate a possible loss when the thickness value falls outside of the range of test-retest variability. When the subsequent follow-up scan confirms the change, the area is marked in red to denote a likely loss. To determine progression, event analysis was employed; changes marked in red as likely losses were taken to strongly suggest structural progression [14]. Out of 41 patients included in the study, 15 patients showed significant progression at the peripapillary RNFL (Fig. 1A–1D) and 14 patients at the macular GCIPL (Fig. 2A–2D). Twelve patients demonstrated progression in both regions, but earlier structural progression was identified at the RNFL in six of these patients and at the GCIPL in the other six patients. For comparisons, the 20 patients who showed progression at the macular GCIPL first were categorized into the “GCIPL progression first” group and those 21 patients who showed their first progression at the peripapillary RNFL were categorized into the “RNFL progression first” group.
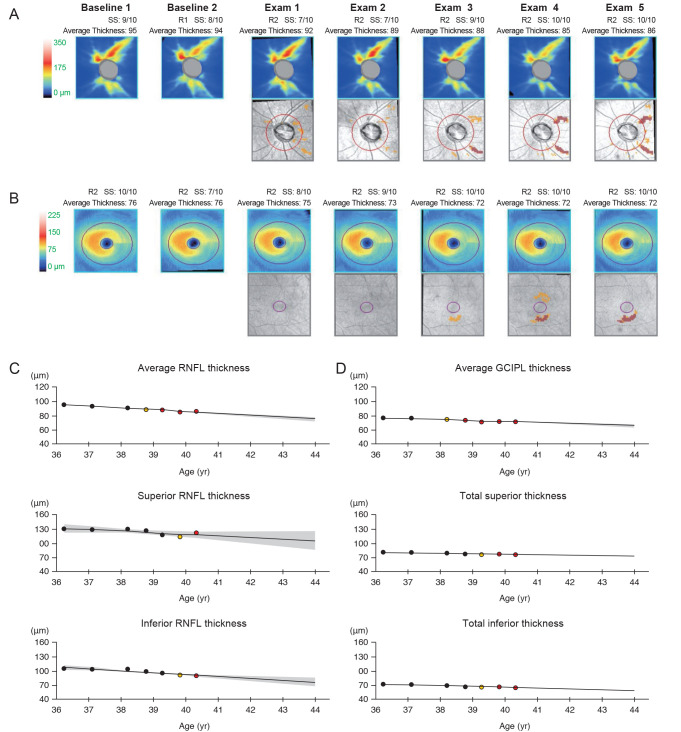
A representative patient showing structural progression first at the peripapillary retinal nerve fiber layer (RFNL). The thickness maps and thickness change maps of the peripapillary RNFL (A) and macular ganglion cell-inner plexiform layer (GCIPL) (B) are presented. Thickness changes are also indicated on graphs for the peripapillary RNFL (C) and macular GCIPL (D). The representative patient progressed first at the inferotemporal RNFL layer during Exam 3; then, progression at the macular GCIPL followed per Exam 4.
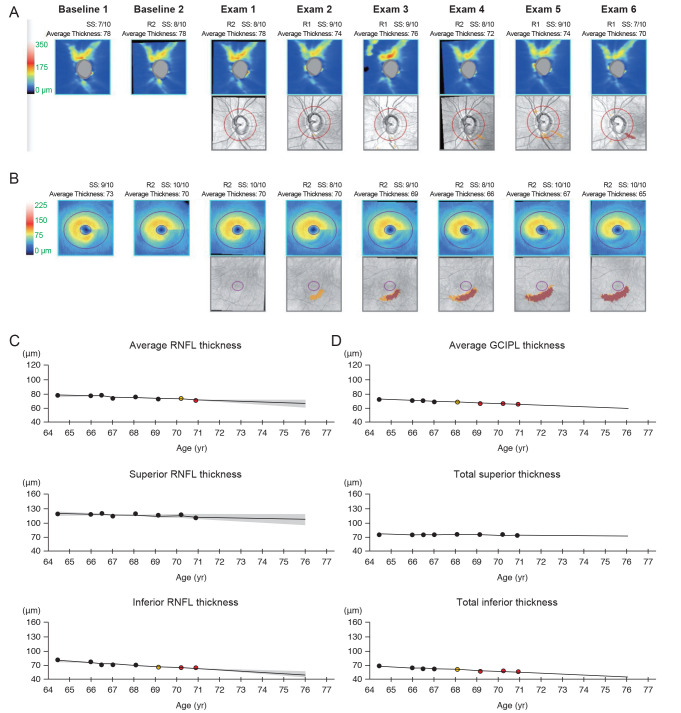
A representative patient showing structural progression first at the macular ganglion cell-inner plexiform layer (GCIPL). The thickness maps and thickness change maps of the peripapillary retinal nerve fiber layer (RNFL) (A) and macular GCIPL (B) are presented. Thickness changes indicated on graphs for the peripapillary RNFL (C) and macular GCIPL (D) suggested progressive thinning of macular GCIPL first before the thinning of RNFL. The structural progression in this representative individual was first confirmed during Exam 3 at the macular GCIPL; findings of RNFL progression followed three exams later, during Exam 6.
Statistical analyses
All continuous data are presented as mean ± standard deviation for normative data, and as median (range) for non-normative data. All categorical data were presented as a number and percentage of the group. The distribution of data for each parameter was determined using Shapiro's test. Comparisons of normally distributed continuous data were performed using the independent Student's t-test and those data that did not follow the normal distribution were compared using the Mann-Whitney U-test. Comparisons of categorical data were performed using the chi-squared test. Simple and multiple regression analyses were performed to identify clinical parameters associated with the region of structural progression. Those parameters that showed statistically significant p-values at the level of simple regression were carried forward to the multiple regression step. All statistical analyses were performed using the R statistical software ver. 3.6 (R Foundation for Statistical Computing, Vienna, Austria). A p-value less than 0.05 was considered statistically significant.
Results
Patient demographics
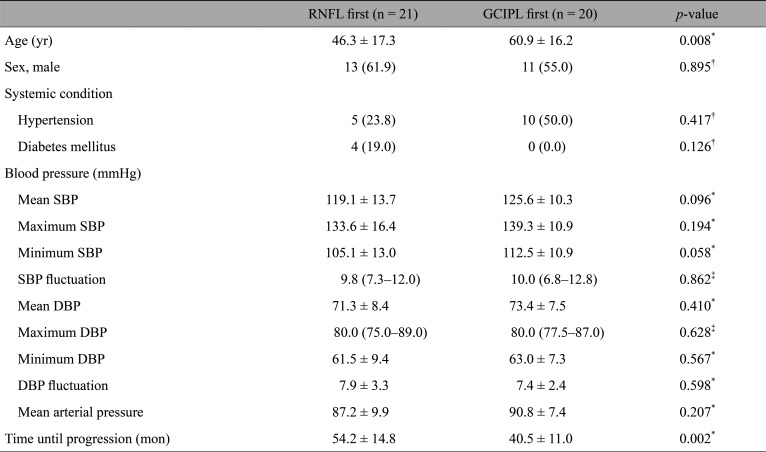
A total of 41 patients were enrolled in the present study. The RNFL progression first group consisted of 21 patients. Thirteen patients (61.9 %) were males and 46.3 ± 17.3 years old on average. The GCIPL progression first group consisted of 20 patients; 11 (55.5 %) were males, and were 60.9 ± 16.2 years old on average. The results of the comparisons of demographics between the two groups are illustrated in detail in Table 1. While the percentage of males did not differ between the two groups, the GCIPL progression first group was significantly older (p = 0.008). The two groups also did not show significant differences in the percentages of patients diagnosed with hypertension or diabetes mellitus. No parameters regarding blood pressure showed a statistically significant difference. Progression was detected earlier in the GCIPL progression first group (40.5 ± 11.0 months) than in the RNFL progression first group (54.2 ± 14.8 months, p = 0.002).
Comparison of baseline clinical characteristics and medical history between patients with RNFL progression first and GCIPL progression first
Comparison of ocular characteristics
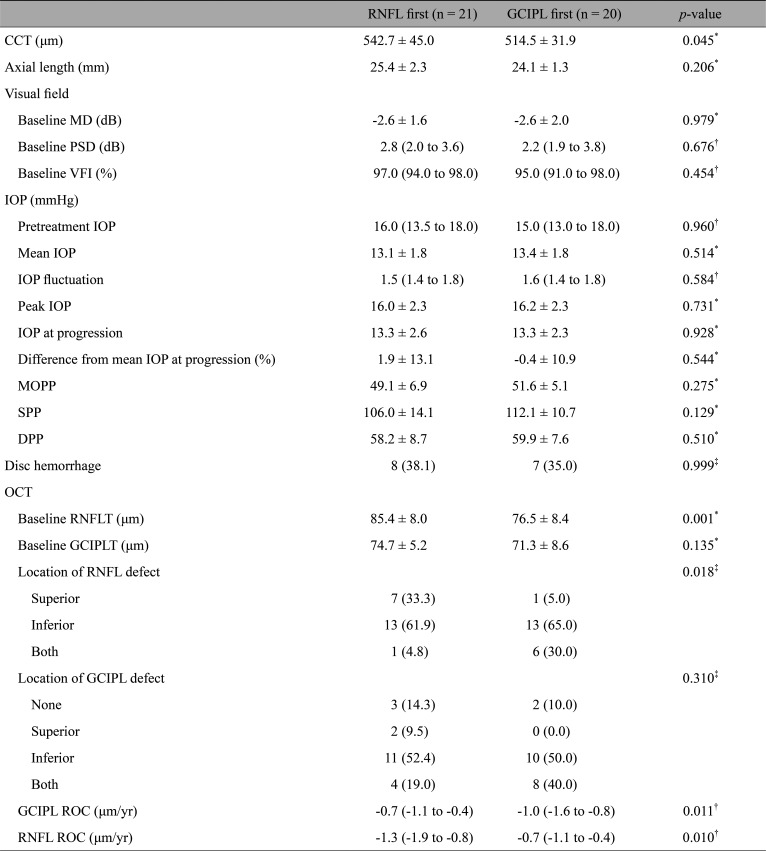
Table 2 presents the comparisons of ocular characteristics between the RNFL progression first group and GCIPL progression first group. The axial length between the two groups was similar. The central corneal thickness was slightly thicker on average in the RNFL progression first group (p = 0.045). At baseline, the RNFL progression first group showed greater RNFL thickness (85.4 ± 8.0 vs. 76.5 ± 8.4 mm/yr, p = 0.001), but similar mean deviation (p = 0.979) and pattern standard deviation (p = 0.832) in comparison to the GCIPL progression first group. During the follow-up period, no parameters regarding IOP showed statistically significant differences between the two groups. The GCIPL progression first group showed faster rates of GCIPL loss (p = 0.033) whereas the RNFL progression first group did not show faster loss rates in RNFL thickness (p = 0.084). At baseline, the two groups showed statistically significant differences in the location of initial RNFL defects (p = 0.018) while no difference was observed in the location of initial GCIPL defects (p = 0.310).
Comparison of ocular characteristics between patients with RNFL progression first and GCIPL progression first
Predictors of the region of structural progression
The clinical parameters were subjected to logistic regression analyses to find associations with the region of structural progression of the disease (Table 3). The simple logistic regression analyses indicated age (odds ratio [OR], 1.053; 95% confidence interval [CI], 1.010–1.098; p = 0.015), baseline RNFL thickness (OR, 0.876; 95% CI, 0.799–0.962; p = 0.005), and time until progression (OR, 0.918; 95% CI, 0.862–0.977; p = 0.007) to be statistically significant. The statistically significant parameters at the level of simple regression were then carried forward to multiple logistic regression. According to the results, macular GCIPL progression was more likely to occur first in older patients (OR, 1.051; 95% CI, 1.001–1.105; p = 0.046). Patients who took longer until they showed their first structural progression were more likely to show progression in the peripapillary RNFL rather than the macular GCIPL (OR, 0.912; 95% CI, 0.840–0.991; p = 0.029).
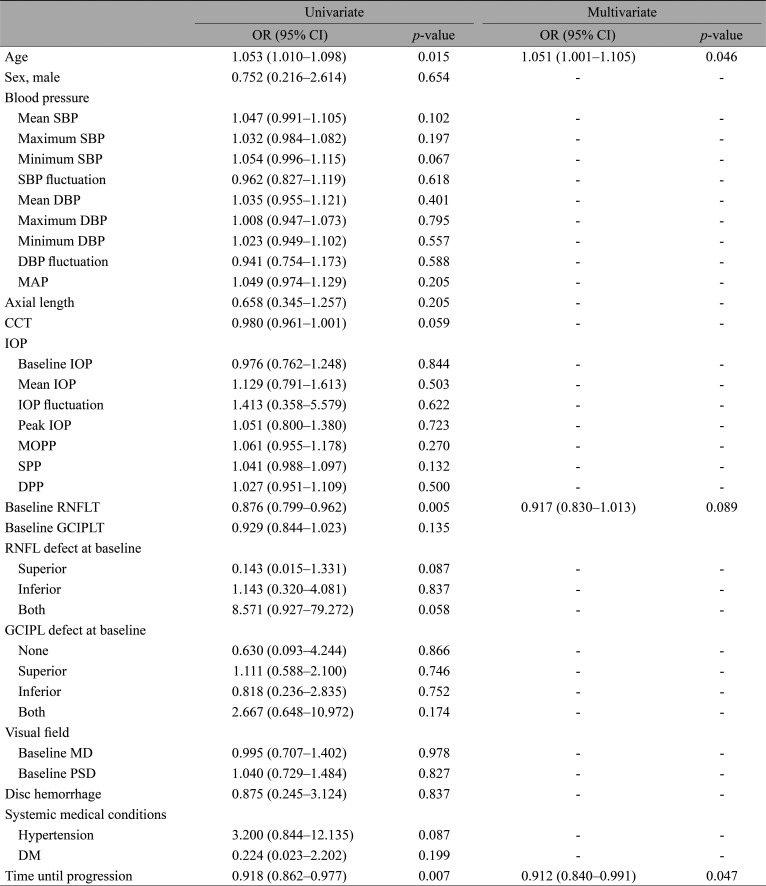
Simple and multiple logistic regression analyses to find predictors of the region of structural progression
Discussion
The present study investigated the clinical characteristics of early NTG patients who either showed their first structural progression at GCIPL or RNFL and attempted to identify clinical parameters associated with the region of structural progression. The results of our study have revealed that those patients who showed structural progression first at the peripapillary RNFL were younger and had thicker RNFL at baseline. According to regression analyses, the first structural progression was more likely to occur at the GCIPL for older patients. Patients who took longer to show the first structural progression were more likely to show progression first at the peripapillary RNFL.
The diagnostic accuracy of the macular GCIPL has been actively investigated [101516]. Not only the lack of a floor effect but also the lower inter-subject anatomic variability of the macula, especially in comparison to the optic nerve head, has made it an attractive topic [817]. Notable studies on this topic include that by Hou et al. [18], who examined open-angle glaucoma (OAG) patients that demonstrated progressive thinning at either RNFL or GCIPL. They concluded that both the GCIPL and RNFL were mutually predictive of VF deterioration. Bussel et al. [19], on the other hand, argued that RNFL analysis remained the most accurate tool of diagnosis for structural progression in glaucoma. A systemic review of relevant literature by Oddone et al. [8] found that RNFL analysis is preferable to GCIPL analysis. The superiority between RNFL and GCIPL was debated during the World Glaucoma Association Consensus Meeting on Progression of Glaucoma, but no consensus was reached [20]. What seems to be at least agreed upon based on the recent literature is that the GCIPL serves as a useful adjunct in glaucoma management.
Why some patients first show their first structural progression at the GCIPL or RNFL is still unknown. In theory, the glaucomatous damage that begins at the level of the lamina cribrosa may cause retrograde degeneration of RGC axons. In this context, the signs of structural damage should first be observed near the disc and subsequently appear at the macular GCIPL as the soma and dendrites of RGCs begin to degenerate [2122]. However, others positioned against this argument have contended that optic nerve damage first affects the dendrites and soma, leading to a thinning of the GCIPL in the macula [21]. The subsequent loss of axons then provokes thinning of the nerve fiber layer. However, the mechanism behind the structural progression remains elusive and clinical factors that predispose glaucoma patients to progression in one region over the other continue to be perplexing.
Recent studies have attempted to explain regions of first structural change with different patterns in which the damage progresses in glaucoma. Notably, Kim et al. [10] have postulated that there exist two predominant patterns of glaucoma damage: (1) an infero-inferior peripapillary RNFL defect that is preceded by RGC changes outside the macula, and (2) GCIPL changes within the macula that occur before corresponding peripapillary RNFL changes [23]. According to their studies, the former may first be detected on OCT scans as a change in RNFL and not the GCIPL because the ganglion cell changes preceding the infero-inferior RNFL damage tend to take place in an area beyond the 36 mm2 of the macula covered by the GCIPL scan [24]. The findings of our study appear to support the conclusions of these aforementioned reports. Our investigation demonstrated that patients who exhibited structural progression later during the course of their follow-up were more likely to show progression at the peripapillary RNFL rather than at the macular GCIPL. By applying Kim's hypothesis to our results, we can extrapolate that patients who demonstrated structural changes at the peripapillary RNFL first possibly did so because their damage in the GCIPL layer near the macula went undetected by OCT. Further, our study supports arguments of previous investigations contending that glaucomatous damage occurs in multiple different patterns not only between different individuals but also within the same individual at the same time. However, the results of this study must also be interpreted in the context of baseline differences in the RNFL thickness and age at diagnosis between the two groups. Although the difference was not significant in the regression analyses, the RNFL progression first group showed thicker RNFL at baseline. Previous studies have reported a negative association between the baseline RNFL thickness and the rate of reduction of RNFL thickness [2]. It is possible that the structural progression was first detected at the RNFL first in the RNFL progression first group simply because the baseline RNFL thickness was not as close to the floor of the RNFL measurement as their counterpart. In this regard, additional studies are needed to validate our results.
The results of our study also suggest that the region of the first structural region is more likely to be the macular GCIPL in older patients (OR, 1.051; 95% CI, 1.001–1.105; p = 0.046). Our results should be interpreted in comparison to age-related thinning of the GCIPL. Previous studies have reported that both RNFL and GCIPL thicknesses naturally decrease with time, approximately at −3.001 and −0.14 to −0.318 µm/yr, respectively [2425]. This thinning, according to studies, is independent of glaucomatous progression. Based on these results, the investigators have added that the decrease in thickness does not always indicate disease progression and that age-related change should be accounted for in examining measurements [24]. Supporting this hypothesis, our comparisons revealed that the baseline RNFL thickness was greater for the GCIPL progression first group, whose constituents were older on average. When age was adjusted by logistic regression analysis, however, the difference in baseline RNFLT between the two groups was statistically insignificant. With regard to the age-related loss of macular thickness, multiple mechanisms have been suggested. One of the most promising theories suggests the deterioration of the retinal microcirculation [26]. Previous reports have found a decrease in the density of retinal microvessels and associated microcirculation to coexist with thinning of the macular layers [27]. Hence, the regressed perfusion of the retina was assumed to be the reason behind decreased visual function with aging [28]. However, it must be noted that numerous studies have attributed the progression of glaucoma to vascular dysfunction in the past as well [293031]. Significantly decreased vessel density in the GCIPL has been identified in glaucoma. In fact, the microvascular changes were able to distinguish glaucoma from healthy eyes [323334]. In one study, the level of macular vessel density even explained the different severities of glaucomatous damage [35]. Disturbed retinal hemodynamics appears to play a critical role in the pathogenesis of OAG [36]. In this regard, the association between age and progression at the macular GCIPL per our analyses may hint at the possible pathogenic mechanism of glaucomatous damage at the macula. Furthermore, we believe that our study compels further examinations to ascertain whether the age-related decline in retinal perfusion aggravates structural progression in glaucoma.
There were several limitations to the present study that should be noted. First, this study had a retrospective design. While associations between age and GCIPL thinning and between progression time and RNFL thinning were found through the retrospective collection of data, the causal relationships between the parameters cannot be ascertained due to the nature of the study design. Second, the study results may not be generalized. The study population consisted of those referred to a tertiary center for specialized management and were only of the Korean population, among whom NTG is known to be more prevalent than OAG with high IOP. Third, the small number of study participants may have affected the results. Despite the limitations, however, we believe that clear relationships between age and GCIPL progression and between time until first structural progression and RNFL progression were firmly established in our study.
In conclusion, the region of structural progression in glaucoma may be predicted by the clinical characteristics of patients. Patients who are younger and have thicker RNFL at baseline tended to show structural progression first at the peripapillary RNFL. In patients who tended to show structural progression later during the course of follow-up, the region of first structural progression was more likely to be the peripapillary RNFL. Further studies are needed to determine the mechanism that explains the region of first structural progression.
Acknowledgements
This work was supported by the Basic Science Research Program through the National Research Foundation of Korea (NRF) funded by the Ministry of Education (No. NRF-2019R1F1A1061795).
Notes
Conflict of Interest: No potential conflict of interest relevant to this article was reported.