Association between Microperimetric Parameters and Optical Coherent Tomographic Findings in Various Macular Diseases
Article information
Abstract
Purpose
To analyze the correlation between microperimetric parameters and optical coherent tomographic findings in the eyes of patients with macular diseases.
Methods
A total of 64 eyes were included in this retrospective cross-sectional study. Differences in the macular integrity index and microperimetric parameters were analyzed according to types of outer retinal band defects. Correlations between average threshold values and retinal thickness in the corresponding areas were analyzed. Finally, microperimetric parameters were compared between inner and outer retinal lesions.
Results
Measures of best-corrected visual acuity, macular integrity index, and average threshold values were significantly worse in eyes with defects in the ellipsoid portion of the photoreceptor inner segment (ISe), the cone outer segment tip (COST), and the external limiting membrane (ELM) than in eyes without ISe, COST, and ELM defects. Also, visual functionality is more significantly impacted by ELM defects than by other hyper-reflective band defects. There was a significant negative correlation between retinal thickness and the average threshold of the corresponding area in the Early Treatment Diabetic Retinopathy Study grid. Microperimetric parameters in the eyes of patients with inner retinal lesions were better than in the eyes of patients with outer retinal lesions.
Conclusions
The macular integrity index may be a useful factor for reflecting the functional aspects of macular diseases. Specifically, ELM, ISe, and COST defects are significantly associated with poor retinal sensitivity and macular integrity index values that suggest abnormalities. Among eyes with these particular defects, the visual functionality of patients is most sensitively impacted by ELM defects. This finding suggests that microperimetric parameters are sensitive and useful for evaluating functional abnormalities in the eyes of patients with macular disease, particularly in patients with outer retinal pathology.
With advancements in medical and surgical techniques, the prognosis of various macular diseases has improved [1,2,3,4]. As a result, accurate evaluation and documentation of residual macular functionality after treatment has become increasingly important. In turn, accurate evaluation of macular functionality helps clinicians to elucidate which treatment modalities are most effective, and to characterize treatment responses in individual patients.
Macular evaluation is based on morphological and functional assessment of the affected eye. With technological advancements, various methods for morphological evaluation of macular disease are currently used, such as optical coherence tomography (OCT), confocal scanning laser ophthalmoscopy, and autofluorescence imaging [5,6,7,8]. Among these methods, spectral domain (SD)-OCT has improved the accuracy of morphological assessment in eyes with macular disease, because SD-OCT displays improved resolution (i.e., axial resolution of 5 to 7 µm in tissue) compared to time-domain OCT (which has axial resolution of 8 to 10 µm in tissue) [9,10,11]. With the improved resolution of SD-OCT, it is possible to visualize hyper-ref lective bands corresponding to the anatomic layers of the human retina, thereby revealing details of the eye's photoreceptor layer. The hyper-reflective lines of the outer retina consist of the external limiting membrane (ELM), the ellipsoid portion of the photoreceptor inner segment (ISe), and the cone outer segment tip (COST) [12,13]. Previous studies have reported that these hyper-reflective lines of the outer retina are significantly associated with visual functionality [12,14,15,16,17].
Until recently, measures of best-corrected visual acuity (BCVA) and perimetry findings have been the main indicators of visual functionality in patients with macular disease. However, the introduction of microperimetry has led to precise topographic correlations between macular anatomy and light sensitivity. The macular integrity assessment device (MAIA; CenterVue, Padova, Italy) is a third generation microperimetry system that measures visual sensitivity and fixation stability (FS) using 61 or 37 Goldmann-style stimulus points within a 10-degree radius centered on the fovea. Unlike other microperimetric instruments, the MAIA automatically calculates and displays a macular integrity index by using the number of stimuli lower than 26 dB, the sensitivity of the central stimuli, and the FS factor. The macular integrity index is a numerical value that determines the probability that a patient's responses are normal, suspect, or abnormal when compared to age-adjusted normative data. Higher values of the macular integrity index suggest a greater likelihood of abnormal findings, while lower values suggest a greater likelihood of normal findings.
So far, no existing studies compare the macular integrity index and various SD-OCT parameters. Therefore, this study analyzes the correlations between various microperimetric parameters, including the macular integrity index, and optical coherent tomographic findings. We also assess the correlation between retinal thickness and the average threshold of the corresponding area.
Materials and Methods
Study design and participants
This study was approved by the institutional review board of the Asan Medical Center and follows the tenets of the Declaration of Helsinki. A retrospective review was conducted of all the patients who underwent microperimetric examination at the Asan Medical Center in Seoul, Korea, from March 2013 to July 2013. The inclusion criteria involved 1) the definite presence of abnormal findings in the macular area on SD-OCT, and 2) conduction of microperimetric examination and SD-OCT examination on the same day. Exclusion criteria included eyes with significant media opacities that interfered with microperimetric and SD-OCT evaluation, glaucoma, amblyopia, optic nerve diseases, or previous use of drugs known to interfere with macular functionality (e.g., chloroquine, hydroxychloroquine, and tamoxifen). Normal control data were obtained from 28 contra-lateral eyes of age-matched patients with unilateral disease, such as idiopathic epiretinal membrane, macular holes, ocular trauma, or rhegmatogenous retinal detachment.
Primary and secondary objectives
The primary objective of this study is to determine differences in the values of the macular integrity index, BCVA, total average threshold, and average threshold within a 1,000-µm central subfield area of patients with macular disease according to types of outer retinal band defects. Several secondary objectives of this study aim to determine 1) the correlation between the average threshold and retinal thickness in corresponding areas of the Early Treatment Diabetic Retinopathy Study (ETDRS) grid, 2) which outer retinal hyper-reflective band defects most significantly affect visual functionality, 3) differences in microperimetric parameters between eyes with inner retinal lesions (i.e., without ISe, COST, or ELM disruption) and eyes with outer retinal lesions (including ISe, COST, or ELM disruption), and 4) differences in microperimetric parameters between age-related macular degeneration (ARMD), epiretinal membrane, and macular edema.
Ophthalmic examinations
All patients underwent a complete bilateral ophthalmic examination, including assessment of BCVA using the Snellen eye chart. BCVA results were converted to the logarithm of the minimum angle of resolution (logMAR) scale. All patients also underwent biomicroscopic and fundus examinations. The Heidelberg Spectralis (Heidelberg Engineering, Heidelberg, Germany) was used to obtain SD-OCT images of the macula using a custom 20° × 20° volume acquisition protocol to obtain a set of high-speed scans from each eye. With this protocol, 25 cross-sectional B-scan images were obtained, each composed of 512 A-scans. The four bands of the outer retina are shown in Fig. 1, and consist of the ELM, ISe, COST, and the retinal pigment epithelium [13]. With the obtained SD-OCT images, the presence of ELM, ISe, and COST defects within a 1,000-µm central subfield area were determined. ELM, ISe, and COST defects were analyzed by two independent observers (DYK and HYY). If there was a discrepancy in interpretation, a third observer (JYL) was asked to analyze the defect within the 1,000-µm central subfield area. We also determined the retinal thickness within each ETDRS grid by automatically segmenting the retina and measuring the thickness. The automatically-segmented retinal thickness was reviewed by a retina specialist (JYL). If there were segmentation errors in the automatic segmentation, the segmented line was manually modified by JYL.
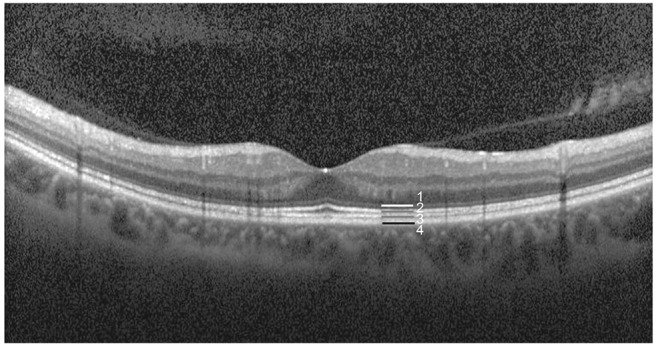
Outer hyper-reflective bands on spectral domain optical coherent tomography. Band 1, external limiting membrane; band 2, ellipsoid portion of the photoreceptor inner segment; band 3, cone outer segment tip; band 4, retinal pigment epithelium.
For the microperimetric analysis, the MAIA device was used with 37 Goldmann-style stimulus points to measure the macular integrity index, the total average threshold, the average threshold in each ETDRS grid area within 3,000 µm, and FS. For FS, P1 and P2 were defined as the percentage of fixation points within a circle of 1° and 2° radii, respectively.
Correlation of spectral domain optical coherence tomography imaging and the average threshold of the corresponding area
A thickness map and average threshold values of the corresponding area are shown in Fig. 2. On the SD-OCT images, the diameter of the first and second circles were 1,000 and 3,000 µm, respectively. In microperimetry, the diameter of the first, second, and third circles were 1,000, 2,000, and 3,000 µm, respectively. Therefore, 13 stimulus points within a 1,000-µm diameter in microperimetry corresponded to the area within the first circle of the SD-OCT image. The second and third circles of microperimetry corresponded to the area between the first and second circles of the SD-OCT image. Therefore, six stimulus points of the second and third circles in each quadrant (i.e., the superior, nasal, inferior, and temporal quadrants) approximately corresponded to each area in the ETDRS grid.
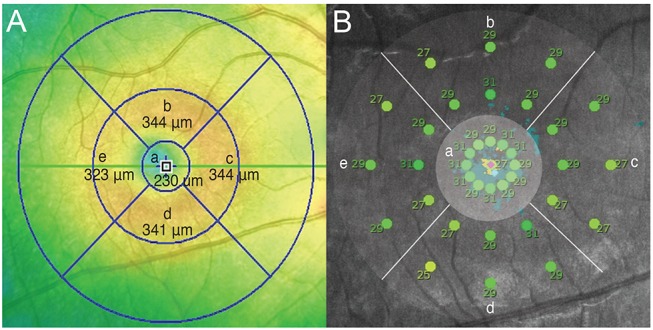
Retinal thickness map (A) and average threshold of the corresponding area (B). (a) Fovea center within a 1,000-µm diameter, (b) superior to fovea center (1,000 to 3,000 µm), (c) nasal to fovea center (1,000 to 3,000 µm), (d) inferior to fovea center (1,000 to 3,000 µm), and (e) temporal to fovea center (1,000 to 3,000 µm).
Statistical analysis
The Kolmogorov-Smirnov test was used to determine whether the data were normally distributed. To compare microperimetric parameters, the Mann-Whitney U-test and Kruskal-Wallis test were used. Pearson correlation analysis was used to analyze the relationship between retinal thickness in the corresponding area of the ETDRS grid and the average threshold in the same area. Receiver operating characteristic (ROC) curves were generated according to the presence of ISe, COST, and ELM defects. IBM SPSS ver. 21.0 (IBM Corp., Armonk, NY, USA) was used for all statistical analyses, and a p-value of <0.05 was considered statistically significant.
Results
Patient characteristics
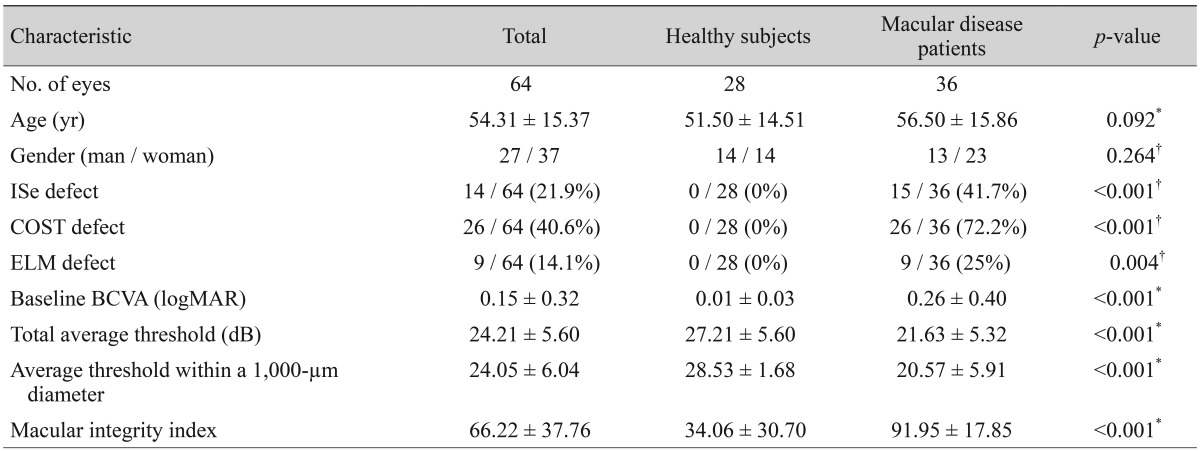
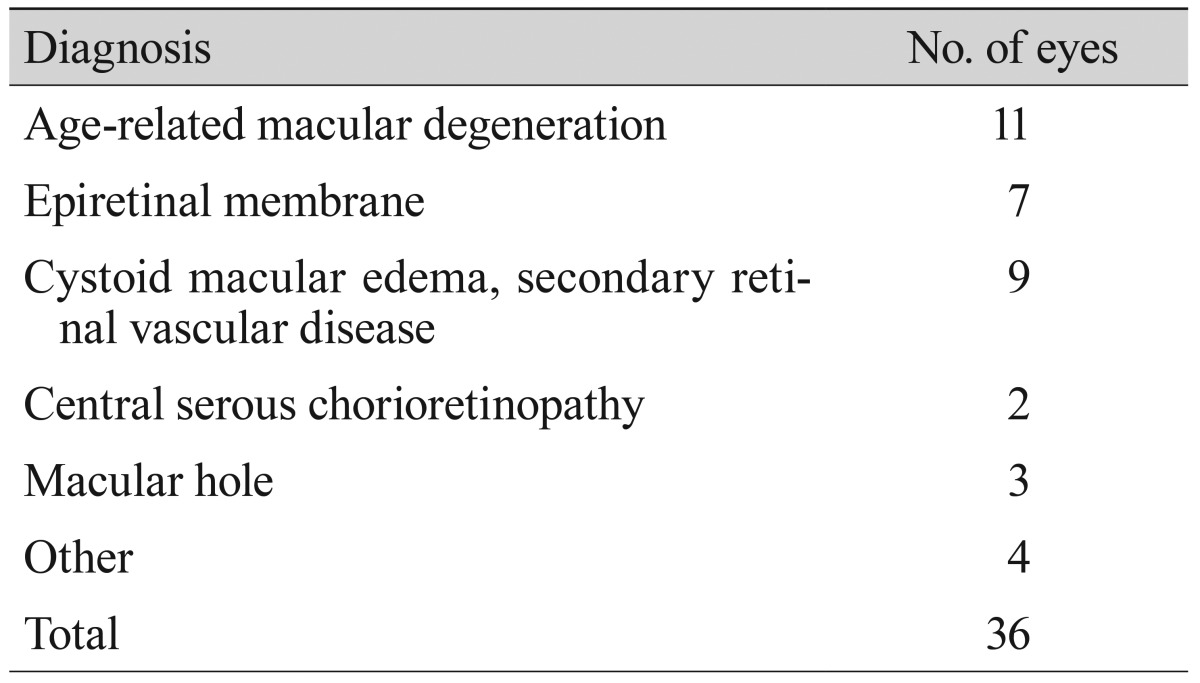
A total of 36 eyes from 32 patients satisfied the inclusion and exclusion criteria, and were therefore analyzed in this study. In addition, 28 eyes of healthy subjects were used as controls. The clinical characteristics of the patients with macular disease and the healthy subjects are shown in Table 1. Age and gender were not significantly different between the two groups. However, the logMAR BCVA of patients with macular disease was significantly lower than that of the control group (p < 0.001). The macular integrity index of healthy eyes was significantly greater than the macular integrity index of eyes with macular disease (34.06 ± 30.70 vs. 91.95 ± 17.85, p < 0.001). The values of total average threshold and the average threshold within a 1,000-µm diameter of healthy eyes were also significantly greater than these values in the eyes of patients with macular disease. The clinical diagnoses of all cases of macular disease are shown in Table 2. Of the 36 eyes of patients with macular disease, 11 eyes had ARMD, seven eyes had epiretinal membrane, and nine eyes had macular edema secondary to retinal vascular disease.
Primary objective
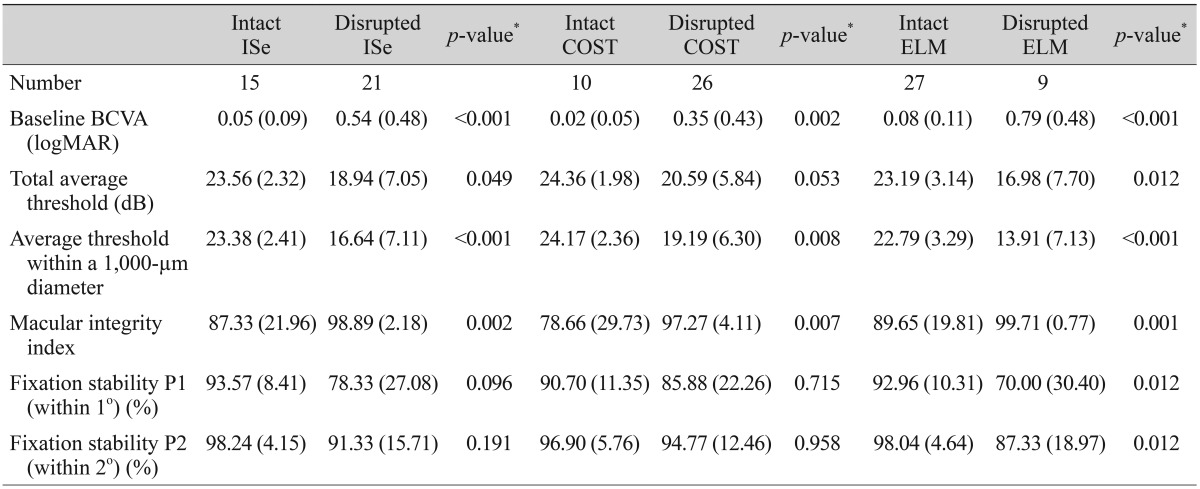
The microperimetric parameters according to ELM, ISe, and COST defects in eyes with macular disease are shown in Table 3. Of the 36 eyes with macular disease, 15, 26, and nine had ISe, COST, and ELM defects, respectively. The macular integrity index was significantly worse in eyes with ISe, COST, or ELM defects than in eyes with intact ISe, COST, and ELM (ISe intact 87.33, ISe defect 98.89, p = 0.002; COST intact 78.66, COST defect 97.27, p = 0.007; ELM intact 89.65; ELM defect 99.71, p = 0.001). Furthermore, values of BCVA, total average threshold, and average threshold within a 1,000-µm diameter were also significantly worse in comparison to these values in eyes with intact ISe, COST, and ELM.
Secondary objectives
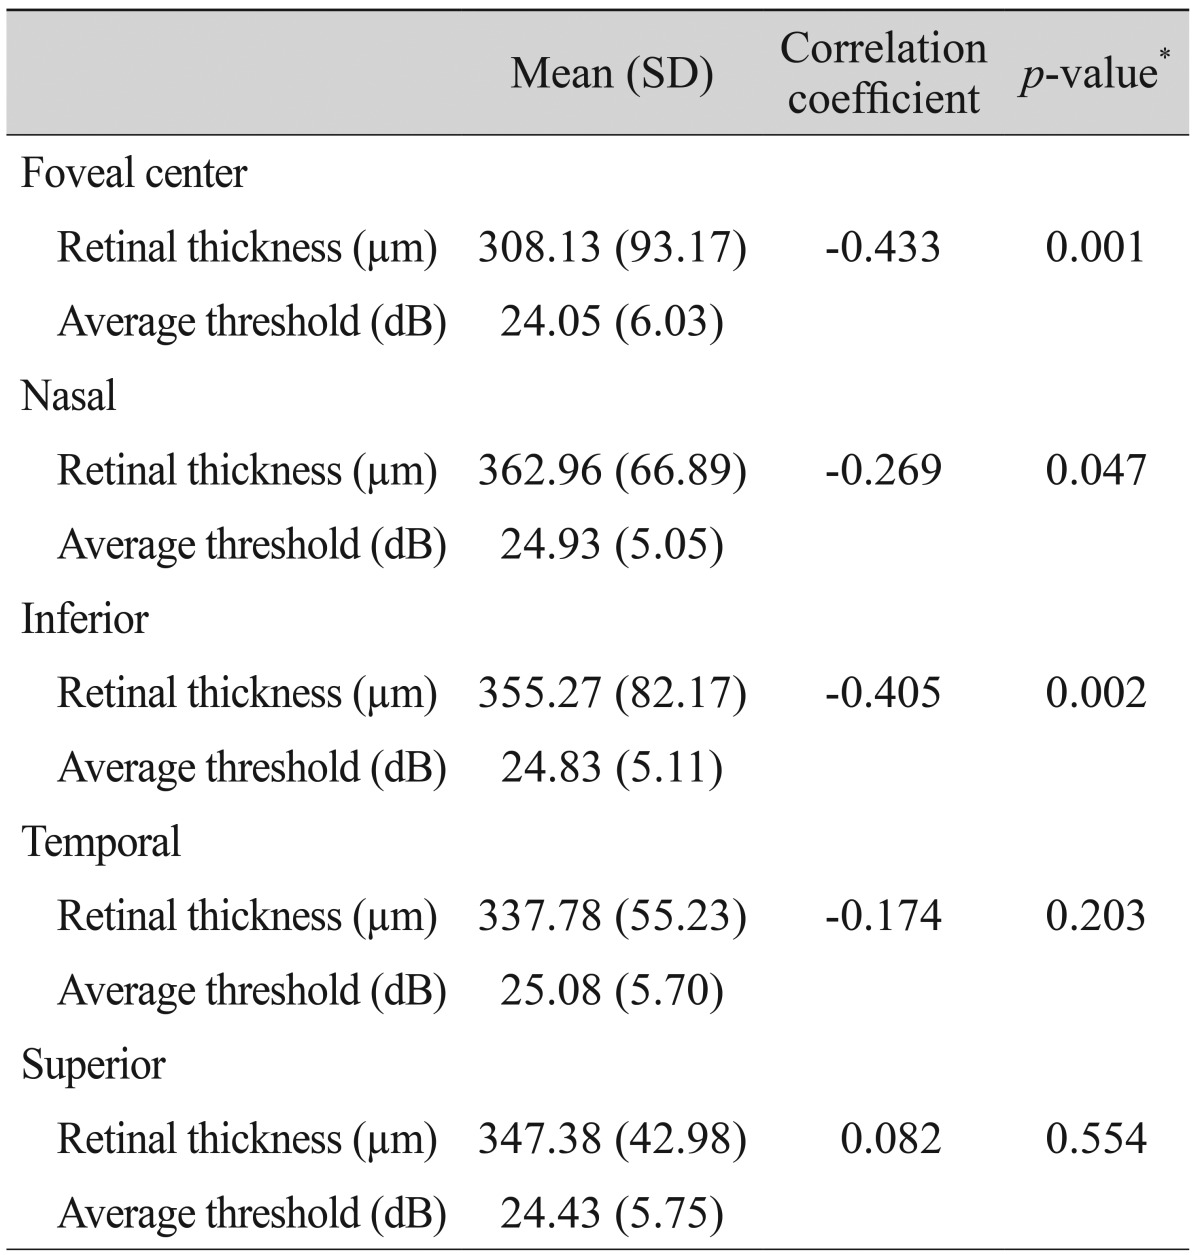
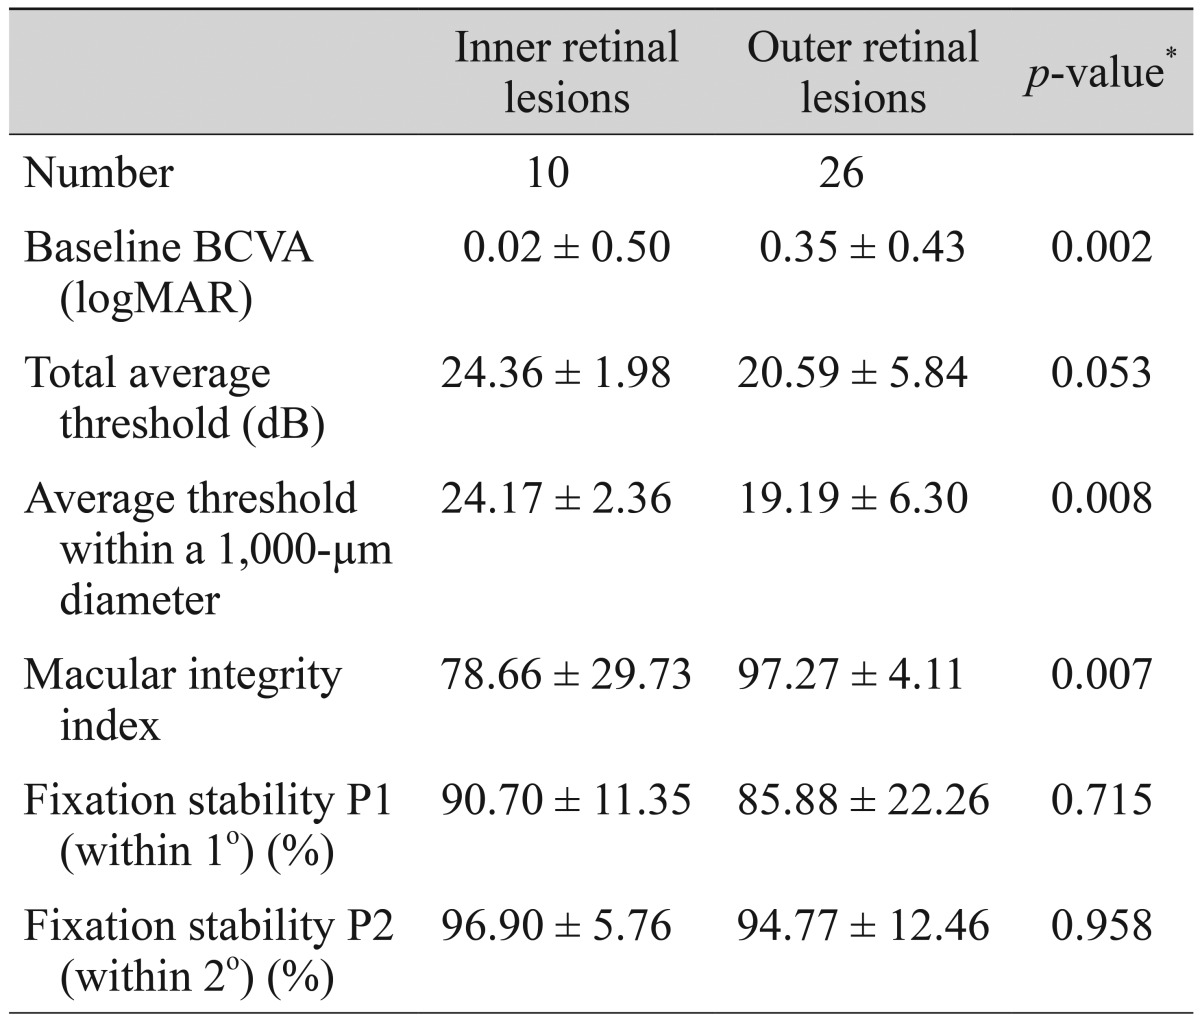
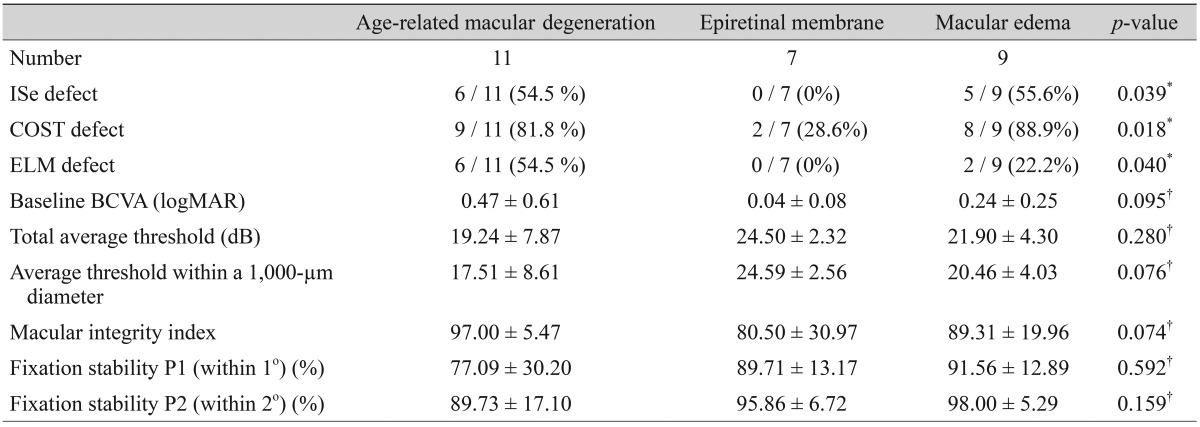
Retinal thickness values according to microperimetric thresholds of the corresponding area are shown in Table 4. At the center, nasal, and inferior sides of the fovea, there were significant negative correlations between retinal thickness and the average threshold of the corresponding area. ROC curves for average threshold within a 1,000-µm diameter and minus logMAR BCVA values according to ISe, COST, and ELM defects are shown in Fig. 3. The area under the ROC (AUROC) curve for ELM defects was larger than the AUROCs of COST and ISe defects. BCVA and microperimetric parameters in patients with inner retinal lesions and outer retinal lesions are shown in Table 5. The macular integrity index values of inner retinal lesions were significantly greater than the macular integrity index values of eyes with outer retinal lesions (78.66 ± 29.73 vs. 97.27 ± 4.11, p = 0.007). The microperimetric parameters of patients with ARMD, epiretinal membrane, and macular edema are shown in Table 6. Values of the macular integrity index, BCVA, and average threshold within a 1,000-µm diameter were superior in the eyes of epiretinal membrane patients than in the eyes of patients with ARMD and macular edema, but this finding was not statistically significant. The rate of ISe, COST and ELM defects was significantly higher in the eyes of patients with ARMD and macular edema than in the eyes of patients with epiretinal membrane.
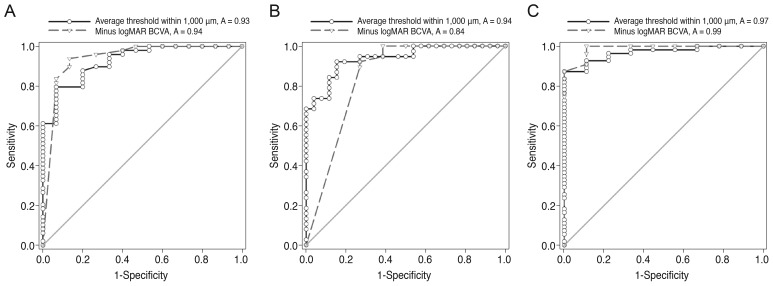
Receiver operating characteristic (ROC) curves for average threshold within a 1,000-µm diameter and minus logarithm of the minimum angle of resolution (logMAR) best-corrected visual acuity (BCVA) according to (A) ellipsoid portion of the photoreceptor inner segment (ISe), (B) cone outer segment tip (COST), and (C) external limiting membrane (ELM) defects. The areas under the ROC curve (AUROC curve values) for the average threshold within a 1,000-µm diameter and minus logMAR BCVA according to ISe defects were 0.927 (95% confidence interval [CI], 0.860 to 0.995; p < 0.001) and 0.940 (95% CI, 0.861 to 1.020; p < 0.001), respectively. AUROC curve values for the average threshold within a 1,000-µm diameter and minus logMAR BCVA according to COST defects were 0.938 (95% CI, 0.884 to 0.992; p < 0.001) and 0.844 (95% CI, 0.747 to 0.941; p < 0.001), respectively. AUROC curve values for the average threshold within a 1,000-µm diameter and minus logMAR BCVA according to ELM defects were 0.968 (95% CI, 0.928 to 1.001; p < 0.001) and 0.988 (95% CI, 0.963 to 1.013; p < 0.001), respectively.
Discussion
BCVA, contrast sensitivity, and perimetry have been used to assess macular functionality. Among these measures, BCVA is the most useful measure of the functional status in eyes with macular disease. However, BCVA does not correlate topographic findings of macular anatomy with light sensitivity. The introduction of microperimetry has made it possible to determine the precise topographic correlations between macular anatomy and light sensitivity [18].
In this study, we analyze the correlations between various microperimetric parameters, including the macular integrity index, and various optical coherent tomographic findings. To evaluate macular sensitivity, we use MAIA microperimetry, which provides not only accurate sensitivity maps of the central retina, but also generates a unique macular integrity index. Several previous studies have compared light sensitivity between microperimetry and SD-OCT findings. However, no existing studies compare the macular integrity index and various SD-OCT findings.
The work of Yohannan et al. [15] reports a correlation between retinal sensitivity and the status of the photoreceptor inner segment/outer segment layers in patients with diabetic macular edema (DME). That research reports that disruption of ISe correlates with a significant decrease in point sensitivity in eyes with DME. In addition, a study by Querques et al. [19] reports that reduced retinal sensitivity consistently correlates with disrupted ISe in AMD patients. A study by Reibaldi et al. [20] reports that in the eyes of patients with lamellar holes, preservation of the ELM is related to the maintenance of visual acuity. The work of Fujita et al. [16] reports that in patients with resolved central serous chorioretinopathy following photodynamic therapy, the improvement of vision is correlated with the recovery of the ISe and COST lines at six and 12 months post-therapy. Each of these previous studies suggests that the outer retinal bands (i.e., ELM, ISe, and COST) are significantly related to visual functionality. Likewise, the current study also finds that retinal sensitivity is consistently affected by ELM, ISe, and COST status in patients with macular disease. Along with decreased point retinal sensitivity, disruption of the ELM, ISe, and COST significantly correlates with decreased macular integrity index values in the eyes of patients with macular disease. This study also analyzes differences in microperimetric parameters between inner and outer retinal lesions. The results show that microperimetric parameters are worse in eyes with outer retinal lesions than in eyes with inner retinal lesions. Therefore, microperimetric parameters are more sensitive and useful for evaluating functional abnormalities in outer retinal pathology.
The macular integrity index is a numerical value that describes the probability that a patient's responses are normal, suspect, or abnormal when compared to age-adjusted normative data. Higher macular integrity index values suggest a greater likelihood of abnormal findings, while lower values suggest a greater likelihood of normal findings. The present study shows that, along with BCVA and average threshold values, the macular integrity index reflects the functional status of eyes with macular disease, revealing morphological alterations of the macula in particular.
ROC curve analysis for minus logMAR BCVA and the average threshold within a 1,000-µm diameter was conducted according to ISe, COST, and ELM defects. While a direct comparison of ROC curves according to types of outer retinal hyper-reflective bands was not performed, the AUROC was relatively large in patients with ELM defects (Fig. 3). A study by Chhablani et al. [21] reports that ELM is a predictor of visual improvement in DME patients following pars plana vitrectomy. The work of Oishi et al. [22] reports a significant relationship between ELM status and visual acuity in the eyes of patients with ARMD. Taken together with these reports, our data suggests that visual functionality is more significantly affected by ELM defects than by other hyper-reflective band defects. Therefore, the status of ELM may be the most useful factor in evaluating retinal morphology and functionality in patients with macular diseases.
The work of Mylonas et al. [23] reports a positive response in retinal sensitivity to ranibizumab treatment for macular edema after acute branch retinal vein occlusion. That research reports that retinal sensitivity improves with improvements in retinal thickness at the foveal center. A study by Munk et al. [24] investigates visual acuity and microperimetric mapping of lesion areas in eyes with inflammatory cystoid macular edema. That study reports that thickening of the neurosensory-fovea has a significant impact on both BCVA and retinal sensitivity. This study not only analyzes the correlation between average threshold and retinal thickness at the foveal center, but also the correlation between the average threshold and retinal thickness of the corresponding area in the ETDRS grid. We find a significant negative correlation between retinal thickness and the average threshold of the corresponding area at the foveal center, as well as at the nasal and inferior sides of the fovea. However, we find no significant correlation between retinal thickness and the average threshold of the corresponding area at the temporal and superior sides of the fovea. We are unable to surmise why retinal thickness is not negatively correlated to the average threshold of the corresponding area in certain extrafoveal lesions. Histopathologic studies on monkeys and humans demonstrate the presence of more ganglion cells in the nasal sector compared to other areas [25,26,27]. Based on this report, we hypothesize that pathologies on the nasal side of the fovea may have a more significant impact on retinal functionality. Indeed, we note a significant negative correlation between retinal thickness and the average threshold on the nasal side of the fovea.
This study analyzes differences in microperimetric parameters between the eyes of patients with ARMD, epiretinal membrane, and macular edema secondary to retinal vascular disease. ARMD, macular edema, and epiretinal membrane are representative of outer retinal disease, inner retinal disease, and retinal surface disease, respectively. Our results show that the rate of outer retinal band defects is significantly different between the three diseases. Moreover, outer retinal band defects in the eyes of patients with ARMD and macular edema are more significantly observed than in the eyes of patients with epiretinal membrane. Because of the higher rate of ISe, ELM, and COST defects in patients with ARMD and macular edema, the microperimetric parameters of eyes with ARMD and macular edema are much worse than the microperimetric parameters of eyes with epiretinal membrane. Therefore, microperimetric parameters are more sensitive and useful for evaluating functional abnormalities in outer retinal pathology.
The strengths of this study include the careful analysis of SD-OCT images by retinal subspecialists (DYK, HYY, and JYL), who were blinded to the clinical information of the patients. In addition, this is the first study to compare the macular integrity index with various SD-OCT parameters. Unlike other studies, which assess the correlation between central retinal thickness and light sensitivity, the present study analyzes the correlation between retinal thickness and the average threshold of the corresponding area at the foveal center, as well as in the extrafoveal area. However, the present study has some limitations that are inherent to the retrospective design of the study. The sample size of this study is relatively small, which may limit the statistical strength of the analysis. Therefore, future studies that examine a larger number of patients are needed to confirm a correlation between microperimetric parameters and SD-OCT findings.
In conclusion, the macular integrity index is a useful factor for reflecting the functional aspects of macular diseases. ELM, ISe, and COST defects are significantly associated with poor retinal sensitivity and macular integrity index values that suggest abnormalities. Among these defects, visual functionality is most sensitively impacted by ELM defects. These results suggest that microperimetric parameters are sensitive and useful for evaluating functional abnormalities in the eyes of patients with macular disease, especially in patients with outer retinal pathology.
Acknowledgements
This study was supported by a grant (2010-484) from the Asan Institute for Life Sciences, Seoul, Korea.
Notes
No potential conflict of interest relevant to this article was reported.
