Detecting the Progression of Normal Tension Glaucoma: A Comparison of Perimetry, Optic Coherence Tomography, and Heidelberg Retinal Tomography
Article information
Abstract
Purpose
We compared the abilities of Stratus optical coherence tomography (OCT), Heidelberg retinal tomography (HRT) and standard automated perimetry (SAP) to detect the progression of normal tension glaucoma (NTG) in patients whose eyes displayed localized retinal nerve fiber layer (RNFL) defect enlargements.
Methods
One hundred four NTG patients were selected who met the selection criteria: a localized RNFL defect visible on red-free fundus photography, a minimum of five years of follow-up, and a minimum of five reliable SAP, Stratus OCT and HRT tests. Tests which detected progression at any visit during the 5-year follow-up were identified, and patients were further classified according to the state of the glaucoma using the mean deviation (MD) of SAP. For each test, the overall rates of change were calculated for parameters that differed significantly between patients with and without NTG progression.
Results
Forty-seven (45%) out of 104 eyes displayed progression that could be detected by red-free fundus photography. Progression was detected in 27 (57%) eyes using SAP, 19 (40%) eyes using OCT, and 17 (36%) eyes using HRT. In early NTG, SAP detected progression in 44% of eyes, and this increased to 70% in advanced NTG. In contrast, OCT and HRT detected progression in 50 and 7% of eyes during early NTG, but only 30 and 0% of eyes in advanced NTG, respectively. Among several parameters, the rates of change that differed significantly between patients with and without progression were the MD of SAP (p = 0.013), and the inferior RNFL thickness (p = 0.041) and average RNFL thickness (p = 0.032) determined by OCT.
Conclusions
SAP had a higher detection rate of NTG progression than other tests, especially in patients with advanced glaucoma, when we defined progression as the enlargement of a localized RNFL defect. The rates of change of the MD of SAP, inferior RNFL thickness, and average RNFL thickness differed between NTG patients with and without progression.
The detection of longitudinal progression plays a central role in the diagnosis and management of glaucoma. However, the detection of progression presents significant difficulties in clinical practice, especially in the case of normal tension glaucoma (NTG). The Collaborative Normal-Tension Glaucoma Study (CNTGS) demonstrated that over half of NTG patients without treatment did not display progression of visual field damage during 5 to 7 years of follow-up [1]. The reported estimated slope of the mean deviation (MD) index for deterioration among NTG patients followed for longer than 3 years was between -0.2 dB/yr and -2 dB/yr in the CNTGS report. As shown in this study, NTG progression is slow, and it may be more difficult to detect changes in visual field damage in NTG patients undergoing treatment. Thus, detecting progression and determining the rate of deterioration are important in the management of NTG.
The relationship between structural changes and functional changes of glaucoma has been debated. Structural changes in the optic disc or retinal nerve fiber layer (RNFL) usually occur prior to visual field loss, as determined by standard white-on-white automated perimetry (SAP) [2,3,4]. However, as glaucoma progresses, this relationship becomes more complex. Also, in the later stages of glaucoma, functional measurements may prove more sensitive in detecting progressive damage. For this reason, visual field assessment is still considered the best method to monitor glaucomatous progression in patients with evident functional damage [5,6]. Although automated perimetry has become the standard method for detecting progressive glaucoma, it is known that many patients display changes in the RNFL and/or optic nerve head (ONH) as the only signs of disease progression [3,7,8,9]. Structural measurements usually are more stable than functional measurements [10]. Another advantage of structural measurements is that, in contrast to perimetry, they are unaffected by any learning effects [11]. The discussion of whether structural measurements can detect glaucoma progression earlier than functional measurements, or vice versa, is still ongoing. Further, these measurements have not been compared in the specific case of NTG.
Thus, there is a growing need for methods that can be used for the reliable longitudinal evaluation and early detection of progression of NTG. In our study, we compared the ability of Stratus optical coherence tomography (OCT), Heidelberg retinal tomography (HRT), and SAP to detect NTG progression in patients with RNFL defect enlargements that had been localized photographically. The longitudinal rates of change of all the representative parameters of each test were compared between a progressed and a non-progressed NTG group.
Materials and Methods
In total, 476 patients with NTG were enrolled. The diagnostic criteria for NTG were a peak intraocular pressure consistently ≤21 mmHg without glaucoma medication, a normal open angle, the presence of typical glaucomatous optic nerve and visual field changes, and the absence of an ocular or systemic disorder responsible for the optic nerve damage. Before the diagnosis, at least two reliable and reproducible visual field examinations were obtained using the Humphrey field analyzer and the Swedish Interactive Threshold Algorithm 24-2 test program (HFA 24-2; Carl Zeiss Meditec, Dublin, CA, USA). The criteria for a reliable visual field examination were ≤15% for both false positives and false negatives, and <20% for fixation loss. The criteria for a visual field abnormality were ≥2 adjacent points of ≥5 dB loss and/or ≥1 point of 10 dB loss from the age-corrected normal reference value [12].
Of those enrolled, 104 NTG patients were selected who met the following criteria: a localized RNFL defect visible by red-free fundus photography; a minimum of five separate visits and 5 years of follow-up; a minimum of five reliable SAP, Stratus OCT, and HRT measurements; and a best-corrected visual acuity equal to or better than 20 / 40. Only one eye of each patient was randomly selected for testing. Patients were excluded if they had diabetic retinopathy or other diseases that could cause visual field loss or optic disc abnormalities, a refractive error of >3.00 diopters or <-7.00 diopters, or a previous intraocular surgery other than an uncomplicated cataract extraction with posterior chamber IOL implantation.
At each visit, patients underwent ophthalmologic examination, including tests of visual acuity, refraction, slitlamp biomicroscopy, gonioscopy, Goldmann applanation tonometry, dilated stereoscopic examination of the optic disc, red-free fundus photography, Stratus OCT, HRT, and SAP with the HFA 24-2. All the examinations for a given patient were performed on the same day. Patients visited the clinic every 6 to 12 months, and Stratus OCT, HRT, and SAP were performed every 12 months during follow-up.
Stratus optica coherence tomography
The commercially available OCT, Stratus OCT (Carl Zeiss Meditec), was used for ocular imaging in subjects with dilated pupils. ONH and RNFL thickness scans were obtained for all patients during the same visit. The quality of the Stratus OCT scans was evaluated by an experienced examiner blinded to the subjects' other test results. Scans were considered to be of good quality when they included focused images from the ocular fundus, an adequate signal strength (>6 for RNFL scans), and a centered circular ring around the optic disc (for RNFL scans).
Optical coherence tomography retinal nerve fiber layer thickness measurements
The fast RNFL algorithm was used to obtain RNFL thickness measurements with the Stratus OCT. Three images were acquired from each subject, with each image consisting of 256 A-scans along a 3.4-mm-diameter circular ring around the optic disc. The peripapillary RNFL thickness parameters automatically calculated by the existing Stratus OCT software (ver. 4.0) and evaluated in this study were the average thickness (360° measure), temporal quadrant thickness (316° to 345°), superior quadrant thickness (46° to 135°), nasal quadrant thickness (136° to 225°), and inferior quadrant thickness (226° to 315°).
Optical coherence tomography optic nerve head measurements
The Fast Optic Disc scanning protocol (software ver. 4.0) was used to obtain ONH measurements with the Stratus OCT. During ONH scans, the device automatically determines the disc margin to be the end of the retinal pigment epithelium/choriocapillaris layer. Although the demarcation of the edge of the retinal pigment epithelium can be manually adjusted to improve the outlining of the disc margin, the default disc margin was used in this study to minimize subjectivity.
Heidelberg retinal tomography
HRT (Heidelberg Engineering GmbH, Heidelberg, Germany) provides topographical measurements of the optic disc and peripapillary retina. For each tested eye, three scans were centered on the optic disc, and a mean topography was generated automatically. Magnification errors were corrected using the patient's corneal curvature measurements. An experienced examiner outlined the optic disc margin on the mean topographic image while viewing simultaneous stereoscopic photographs of the optic disc. All images included in the analysis were carefully reviewed for proper centering, focus, and illumination. Mean topography images with a standard deviation >50 microns were discarded. We used HRT ver. 1.5.9.0 or earlier software for acquisition, and used the recently released version 3.0 software for analysis.
Detecting normal tension glaucoma progression
A localized RNFL defect was defined as a dark wedge-shaped area with its tip touching the optic disc margin in the brightly striated pattern of the surrounding RNFL. For the purposes of this study, it was determined that the width of such a defect at a distance of 1 disc diameter from the margin of the optic disc should be larger than that of the major retinal vessel. Enlargement of the localized RNFL defect was defined as a recognizable change in the distance between the border of the RNFL defect and the adjacent reference vessel [13]. Patients were classified as having "progressed NTG" if a change of the localized RNFL defect was detected using red-free fundus photography. The angle between two lines from the center of the optic disc to the optic disc margin where the border of RNFL defect met the optic disc was measured. An increase in this angle was defined as enlargement of the localized RNFL defect [14].
For the assessment of progression using SAP, HRT, and OCT, three experienced observers (HY, JY, and CK) judged whether progression had occurred. Each method of analysis was evaluated independently. The graders were blinded to the patient's clinical history, visual field results, red-free fundus photography assessment results, other OCT and HRT printouts, and the other graders' results.
For each measurement, progression was defined as follows. SAP: (1) The visual field displayed two or more points that had deteriorated by at least 10 dB from the average baseline values for those points; these two progression points were adjacent, and did not cross the nasal meridian; or (2) three or more points had deteriorated by at least 5 dB, with at least one point showing 10-dB deterioration from the average baseline value. SAP progression was defined as three consecutive results meeting the criteria for progression [15].
OCT: Thinning of the mean RNFL thickness by at least 20 µm from the baseline measurement in three consecutive follow-up OCT scans was defined as OCT progression [6,16]. The overall repeatability of the mean RNFL thickness measured by Stratus OCT is reported to range from 9 to 18 µm [17,18]. Therefore, thinning of the mean RNFL thickness by more than 20 µm may suggest disease progression.
HRT: Progression was assessed using topographic change analysis for HRT II (software v.1.7). Topographic change analysis identifies significant reductions in the topographic height from the mean retinal height from two baseline examinations (p < 0.05) by means of a probability map, which superimposes magenta superpixels onto the corresponding regions of the reflectance image. For HRT, progression was defined as the presence of a cluster of at least 20 magenta superpixels (1 superpixel represents an area of 4 × 4 pixels) in each of three consecutive images [19].
Among SAP, HRT, and OCT, tests that had detected progression during the 5-year follow-up were identified. The results of the tests in which progression was detected were further classified according to the state of the glaucoma, as determined by the MD of SAP. The rates of change of the representative parameters in each test that had detected progression were compared between the groups with progressed and non-progressed NTG. Representative parameters were identified by comparing each parameter between the progressed and non-progressed groups.
Statistical analyses
Data were analyzed using SPSS ver. 16.0 (SPSS Inc., Chicago, IL, USA). Differences between groups were analyzed by a two-sample t-test, the Mann-Whitney test, and chi-squared or Fisher's exact tests. A p-value <0.05 was deemed to indicate statistical significance. A linear mixed model was used to determine and compare the slopes of change for parameters that differed significantly between the progressed and non-progressed groups.
Results
Among the 104 eyes with NTG included in the study, 47 eyes (45%) displayed enlargement of a localized RNFL defect that could be detected by red-free fundus photography. Among the eyes displaying NTG progression by this method, progression could be detected in 27 (57%) by SAP, 19 (40%) by OCT, and 17 (36%) by HRT. The detection rate of each test is shown in Fig. 1. Progression was detected by all three tests (SAP, OCT, and HRT) in 3 (6%) of 47 eyes.

Detection rate of progression by each diagnostic test in 47 patients having an eye with normal tension glaucoma that displayed progression, defined as enlargement of a localized retinal nerve fiber layer defect on red-free fundus photography. SAP = standard automated perimetry; HRT = Heidelberg retinal tomography; OCT = optical coherence tomography.
The tests that first detected progression in the progressed group are shown in Fig. 2. When the severity of the glaucoma was classified according to the MD of SAP, SAP detected progression in 44% of patients with early glaucoma and 70% of patients with advanced glaucoma. HRT detected progression in 32% of patients with early glaucoma, but could not detect progression in those with advanced glaucoma. OCT detected progression earlier than other tests for 24% of patients with early glaucoma, 50% with moderate glaucoma, and 30% with advanced glaucoma.

Comparison of methods for detecting disease progression. Sample included 47 patients with normal tension glaucoma who were assessed for enlargement of the localized retinal nerve fiber layer by red-free fundus photography. Data shows detecting disease progression according to glaucoma severity (A, mild glaucoma; B, moderate glaucoma; C, severe glaucoma). MD = mean deviation; SAP = standard automated perimetry; OCT = optical coherence tomography; HRT = Heidelberg retinal tomography.
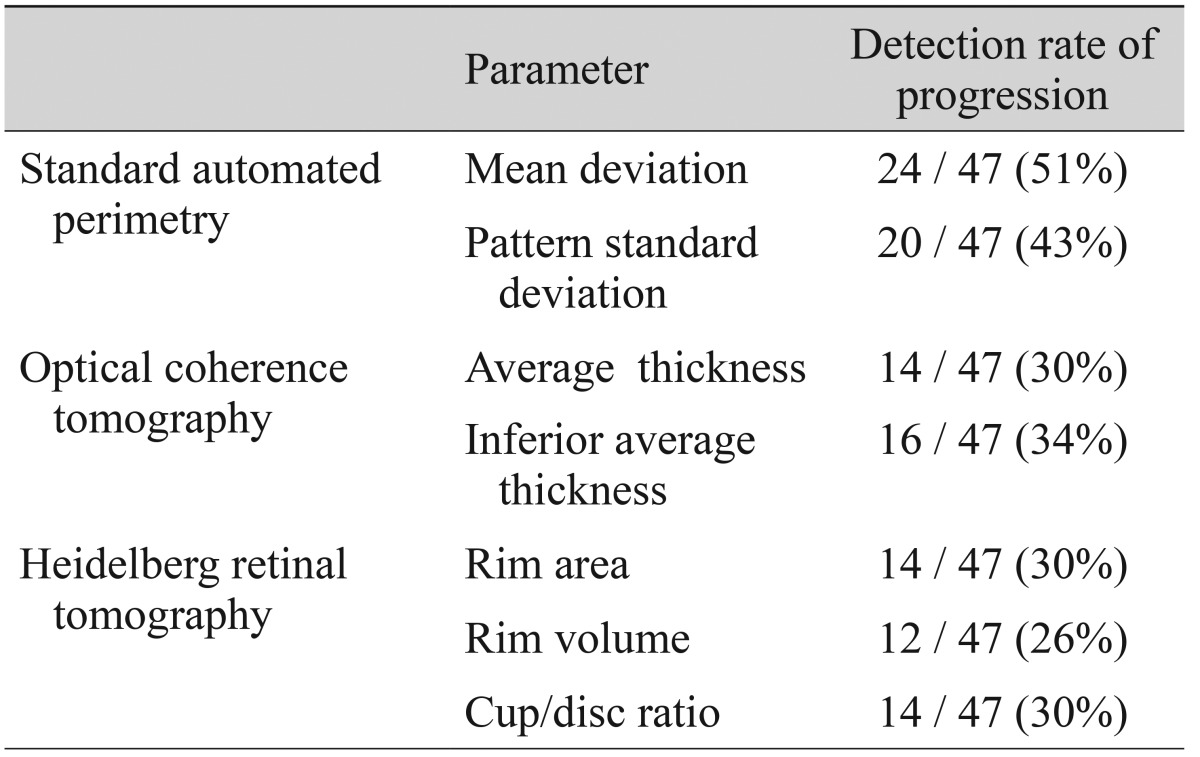
In the 47 patients with progression detected by red-free fundus photography, changes in the parameters of each other test that detected progression were analyzed. Among the SAP parameters, the MD changed for 51% and the pattern standard deviation changed for 43% of patients. Among the OCT parameters, the average RNFL thickness changed for 30% and the inferior average thickness changed for 34% of patients. Among the HRT parameters, the rim area changed for 30%, the rim volume changed for 26%, and the cup/disc ratio changed for 30% of patients (Table 1).
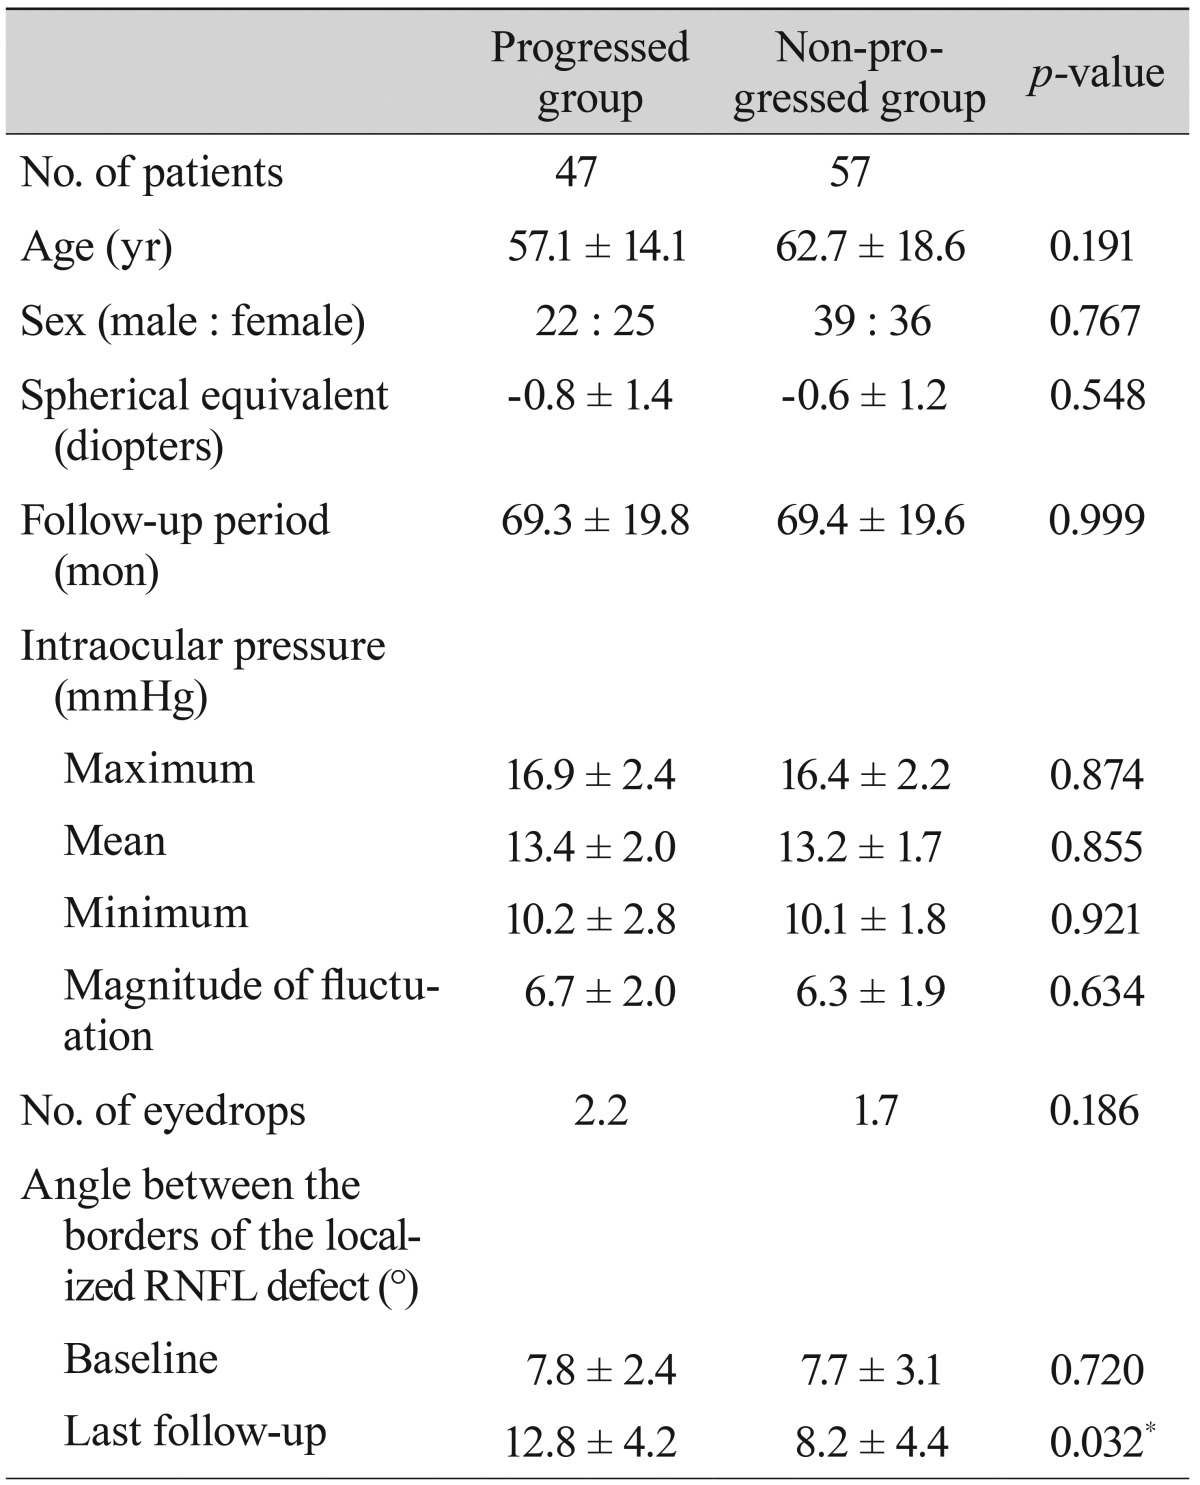
The progressed and non-progressed groups were not different in terms of age, gender, and spherical equivalents. The mean follow-up periods were 69.34 ± 19.78 months in the progressed group and 69.35 ± 19.60 months in the non-progressed group. The maximum, mean, and minimum intraocular pressure and the magnitude of fluctuation did not differ between the groups. The average number of topical antiglaucoma medications used was 2.2 in the progressed group and 1.7 in the non-progressed group; this difference was not significant (Table 2).
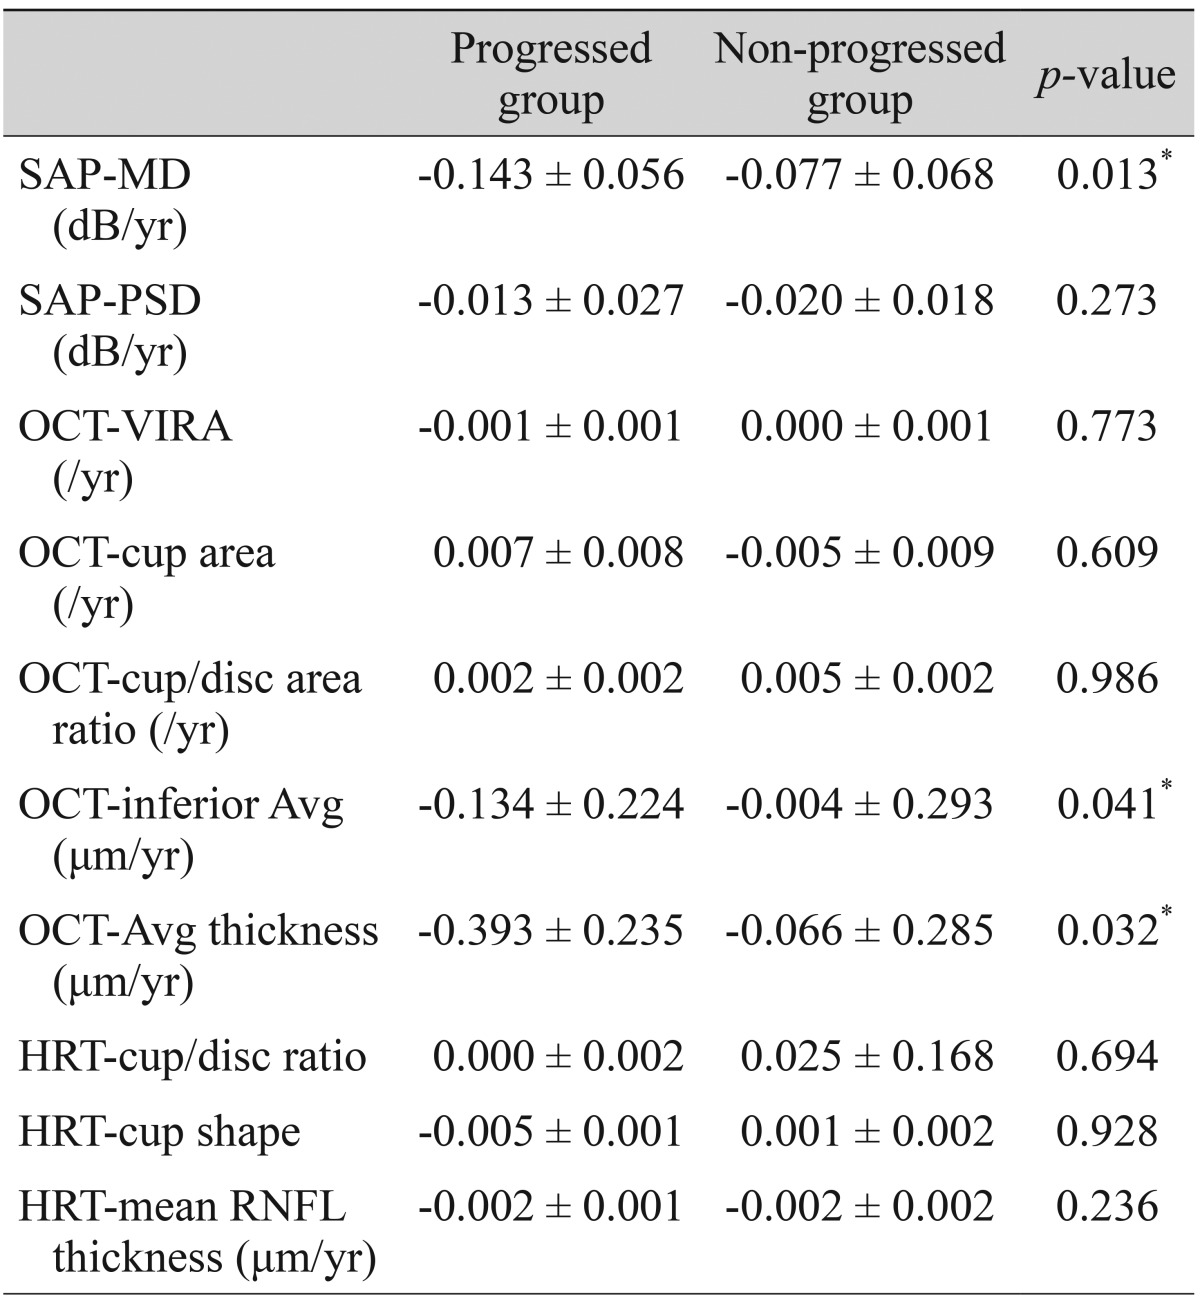
Comparisons of the representative parameters of each test between the progressed and non-progressed groups are presented in Tables 3, 4, and 5. Representative parameters that differed significantly between baseline and the last follow-up in the progressed group, but not the non-progressed group, were the MD of SAP; the vertical integrated rim area, cup area, and cup/disc area ratio determined by HRT; and the inferior RNFL thickness and average RNFL thickness determined by OCT. The rates of change of the representative parameters of each test were calculated (Table 6). The MD of SAP (p = 0.013), inferior RNFL thickness (p = 0.041), and average RNFL thickness (p = 0.032) all decreased at a greater rate in progressors than in non-progressors (Table 7).
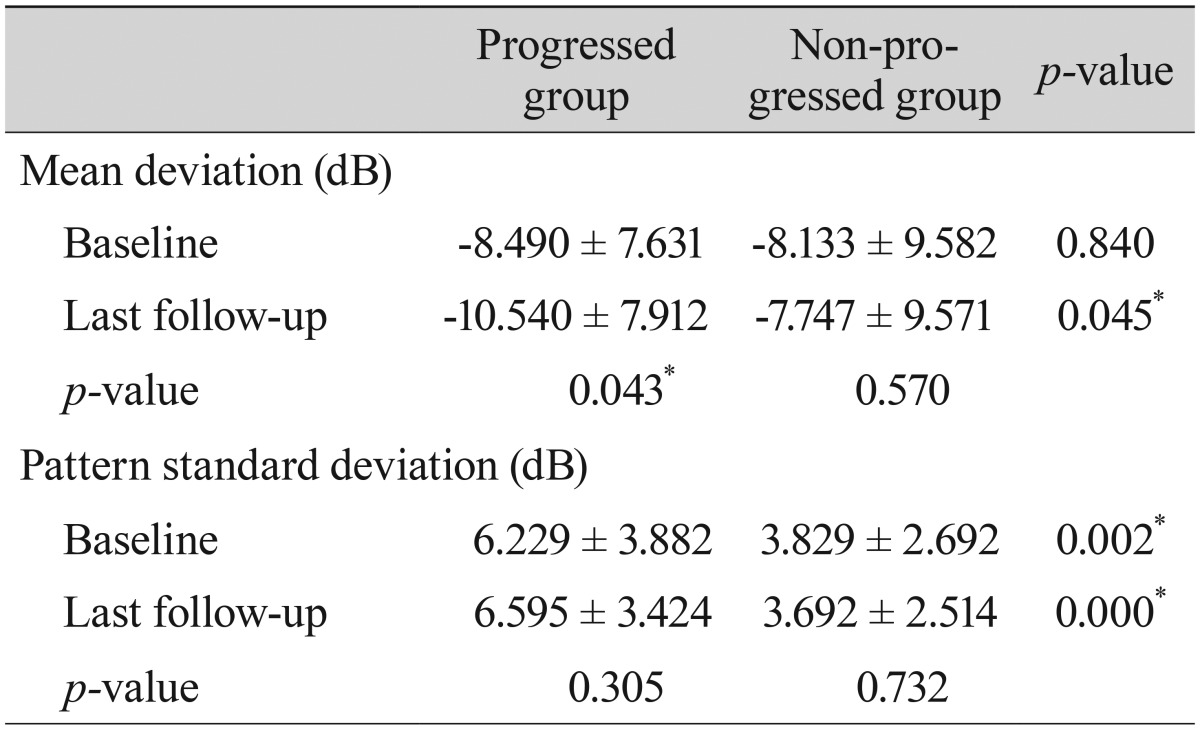
Comparison of parameters by standard automated perimetry between patients with progressed and non-progressed normal tension glaucoma

Comparison of parameters by optic nerve head analysis using optical coherence tomography between patients with progressed and non-progressed normal tension glaucoma
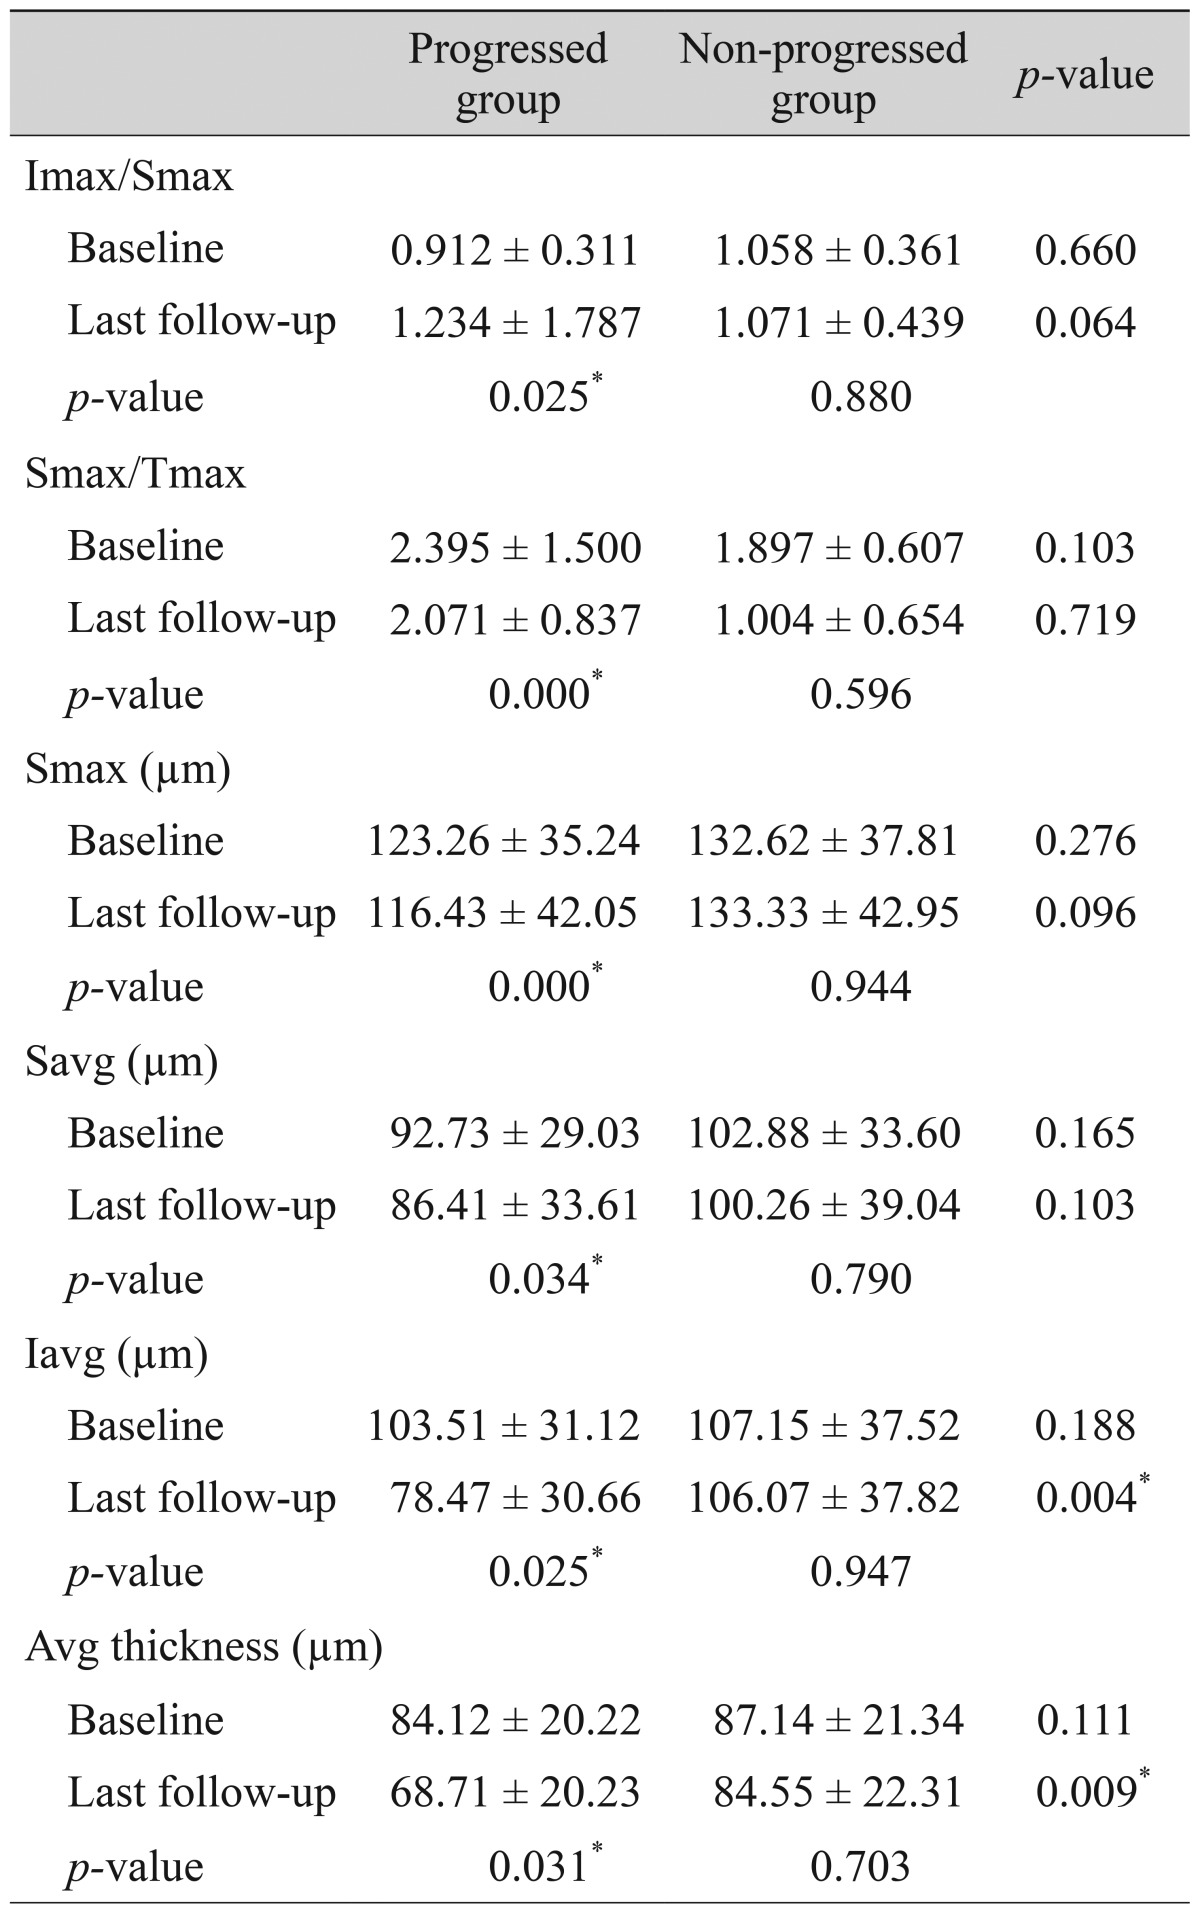
Comparison of parameters by retinal nerve fiber layer analysis using optical coherence tomography between patients with progressed and non-progressed normal tension glaucoma
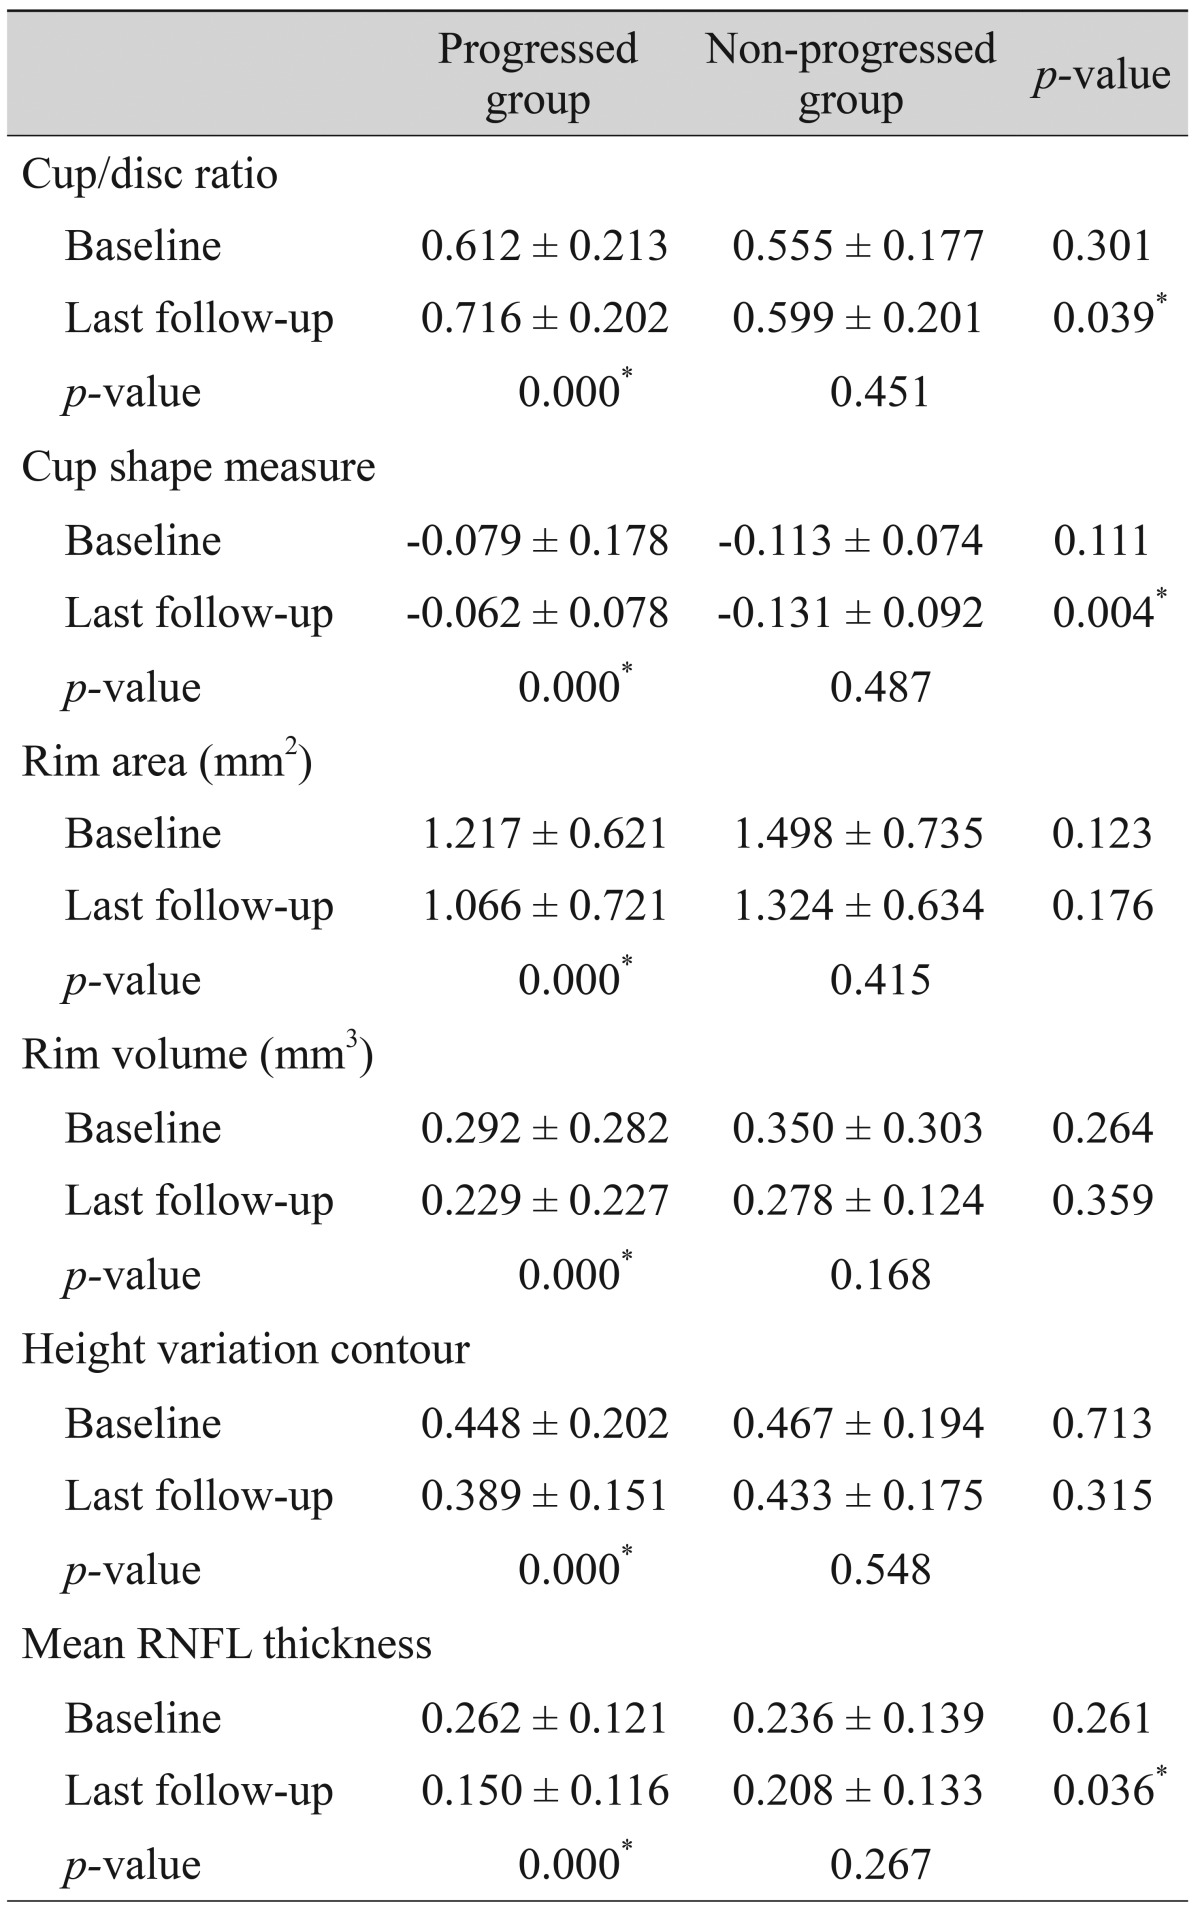
Comparison of parameters by Heidelberg retinal tomography between patients with progressed and non-progressed normal tension glaucoma
Discussion
Detecting longitudinal change and evaluating the rates of change of parameters in various tests is important for identifying glaucoma progression. We found that SAP had a higher detection rate of progression, which increased as glaucoma progressed. The MD of SAP, inferior RNFL thickness, and average RNFL thickness had higher progression rates in progressors than in non-progressors. To our knowledge, this is the first reported study to compare and evaluate longitudinal changes in the parameters of SAP, OCT, and HRT, for monitoring the progression of NTG. Computerized analyses to detect progression in SAP, OCT, and HRT are available. However, they are difficult to apply in clinical practice, and significant and simple indications for the use of these tests in the longitudinal evaluation of NTG progression are needed.
We found that the detection rate of the progression of NTG was the highest with SAP, followed by OCT and HRT. Progression was detected by SAP in 57% and by OCT in 40% of patients. Differences in the detection rates among the three tests were more pronounced as the severity of glaucoma worsened. In early NTG, SAP detected progression in 44% of patients, and this increased to 70% in advanced NTG. HRT detected progression in 32% of patients with early NTG, but did not detect progression in those with advanced NTG. Many reports have indicated a curvilinear relationship between functional and structural changes [2,14,15,16,17,18]. However, some recent studies have suggested a linear relationship between structural and functional changes [20,21]. We are unsure about the exact relationship of structure to function during NTG progression. Our results may indicate that functional and structural changes during NTG progression have a curvilinear relationship. In early NTG, the detection rate of progression using structural measurements was comparable to the detection rate using functional measurements. However, in the more advanced stages of NTG, structural measurements failed to detect the progression of glaucoma, although functional measurements still allowed a high rate of detection of NTG progression.
Among various parameters, the MD of SAP showed the highest detection rate, followed by the pattern standard deviation of SAP and the inferior average thickness determined by OCT. The progressed NTG and non-progressed NTG groups displayed significant differences in several parameters of the SAP, OCT, and HRT tests. However, the longitudinal rates of change were only significantly different between progressors and non-progressors for the MD of SAP, inferior RNFL thickness, and average RNFL thickness. In particular, the MD of SAP changed significantly in the progressors only, with a rate of -0.143 dB/yr. The OCT parameters of inferior average RNFL thickness and average RNFL thickness also changed significantly over time. In several previous cross-sectional studies, this OCT parameter was found to be the best parameter to discriminate glaucomatous from healthy eyes [8,19,20]. Previous reports also have found that OCT ONH parameters [22,23] and HRT parameters [24,25] are reproducible and reliable in discriminating glaucomatous from healthy eyes. However, in the present study, we found that the OCT ONH and HRT parameters were largely unable to differentiate progressed NTG from non-progressed NTG in the longitudinal setting. Although OCT parameters such as vertical integrated rim area, cup area, and cup/disc area ratio, and HRT parameters such as cup/disc ratio and cup shape measure were significantly different between the progressors and non-progressors, the rates of change were not significantly meaningful in the longitudinal setting.
Limitations of our study include that we defined the progressed group only by enlargements of localized RNFL defects. This is the most frequent pattern of progression, reported to be present in 57% of all eyes with progressed NTG [14]. However, there are definitely other types of progression, such as the deepening of a defect and the presence of a new defect, and these were not considered in the present study. Thus, the "non-progressed" patients in our study may have included some patients whose progression manifested itself by other patterns that we did not consider. Further, to compare longitudinal changes, we restricted the inclusion criteria strictly to a minimum of 5-year follow-up. The small number of patients could be one limitation of our study. Finally, evaluation of longitudinal changes must account for test-test variability in repeated measurements. This could have influenced the results of our study with regard to the detection of NTG progression.
In conclusion, SAP had a higher detection rate of progression than HRT and OCT, which was more pronounced in eyes with advanced glaucoma, when we defined progression as the enlargement of a localized RNFL defect. The MD of SAP, inferior RNFL thickness, and average RNFL thickness changed at different rates in progressed eyes (those with enlargements of localized RNFL defects) compared to non-progressed eyes. When assessing progression in the eyes of NTG patients, it will be useful to analyze these parameters longitudinally.
Notes
No potential conflict of interest relevant to this article was reported.
