


A large portion of information that people accumulate is visually acquired [1]. Hence, the demand is rapidly growing for attractive high-resolution displays, leading to further advancements in display technology and industry growth. This demand drives the development of novel display types and improved display technology, such as increased frame rates and resolutions. Thus, ultra-high-definition televisions (UHD TVs) with wearable, portable, or head-up displays and three-dimensional (3D) display systems have been rapidly commercialized, further driving consumer interest in improved displays. UHD TVs feature larger display areas, higher spatial and temporal resolution, and may display a wider color gamut and dynamic range [2]. Such developments are intended to provide viewers with an enhanced visual experience.
However, emerging display technologies, such as 3D motion pictures, have been reported to induce greater visual fatigue compared with traditional displays [3-5]. Transient myopic changes, eyestrain, headaches, and nausea have all been reported to occur with sustained viewing of 3D images [6,7]. It is also a concern that these new commercially available displays are widely being used at homes without surveillance, which may result in relatively long periods of viewing time, with little up-to-date knowledge about their influence on the eyes [8], which may not only pose a problem for healthy adults, but also for schoolage children, elderly viewers, and people with ocular surface diseases such as dry-eye syndrome. Thus, it is necessary to evaluate the subjective symptoms and objective parameters of “ocular fatigue” to provide appropriate guidelines for viewing new image technologies and variable content.
To date, most studies have evaluated ocular fatigue through subjective symptoms and objective measurements [3,4,7-13]. Subjective symptoms have been determined via questionnaires to evaluate visual fatigue and simulator sickness [13]. Objective scores have consisted of changes in visual acuities, refractive errors, intraocular pressure, near point of accommodation, conjunctival hyperemia, tear break-up time, and thermal changes in the ocular surface [3,7,10,12]. However, previous studies yielded variable results, and most enrolled only a small number of subjects [3,7,10,12]. Because of the nature of ocular fatigue, which consists of multi-symptomatic elements, it is hard to identify newly developed discomfort after viewing a display. Moreover, ocular measurements do not directly reflect the degree of ocular fatigue and may actually refer to other factors such as aging or underlying ocular diseases. To the best of our knowledge, no study has evaluated the potential harm of viewing UHD TVs. Therefore, in this study, we performed a prospective experiment to investigate the effects of watching UHD TVs on ocular fatigue and objective indices.
Materials and Methods
A prospective experimental study was conducted on 76 right eyes of 76 volunteers (31 men and 45 women). The exclusion criteria included age younger than 13 years or older than 69 years, ocular disease other than dry-eye syndrome, history of intraocular surgeries including refractive surgeries, refractive error over -6.00 to +6.00 diopters (D), strabismus, nystagmus, and best-corrected visual acuity (BCVA) less than 0.63 on the Snellen chart. No patient was excluded during the screening and testing processes. This study adhered to the Declaration of Helsinki, and the protocol was approved by the institutional review board of Seoul National University Bundang Hospital (B-1510/320-305). Written informed consent to participate in the research protocol was obtained from all subjects.
Ocular examinations before and after watching UHD TV
Each subject who participated in the experiment received a comprehensive ophthalmologic examination before and after watching UHD TV (described below). BCVA, noncycloplegic refraction (Autorefractor KR-8900; Topcon, Tokyo, Japan), tear break-up time (TBUT), fluorescein corneal staining score, and conjunctival redness score (range, 0 to 3 by slit-lamp examination) were obtained. BCVA measured using the Early Treatment Diabetic Retinopathy Study protocol at three meters was converted to the logarithm of the minimum angle of resolution unit for statistical analyses. TBUT and fluorescein corneal staining score measurements were performed with local anesthesia (Alcaine 0.5% Eye Drops; Alcon Laboratories, Fort Worth, TX, USA) and a fluorescein sodium paper strip (Haag-Streit AG, Koeniz, Switzerland). Conjunctival hyperemia was graded using the Cornea and Contact Lens Research Unit grading scale. Meniscus tear measurements were obtained by anterior segment optical coherence tomography (OCT; Spectralis OCT, Heidelberg Engineering, Heidelberg, Germany). Vertical scan images were magnified by 300% and outlines of both the upper and lower menisci at the central cornea, which consisted of the corneal surface, lid margin, and tear meniscus surface, were manually plotted [14].
Subjective symptom data
Before and after watching UHD TV, each subject was asked to complete an ocular symptom questionnaire, which included 10 questions associated with tiredness, soreness, irritation, watery eyes, dry eyes, eyestrain, burning eyes, blurred vision, difficulty focusing, and vision discomfort. Each question was answered according to a seven-category scale (0 = none, 6 = most severe) to sum to a total ocular symptom score.
Watching UHD TV
Of the two TV resolutions that are considered UHD, UHD1 (3,840 × 2,160 pixels) and UHD2 (7,680 × 4,320 pixels), which are 4 and 16 times the resolution of full-high definition, respectively, only the UHD1 resolution was tested in this study. Subjects were required to watch a 10-minute movie clip on a 60-inch UHD TV (ultra-high-definition 4K TV; Samsung Electronics, Suwon, Korea). A previous study evaluating UHD TV viewing experience found that significant ocular fatigue occurred at a distance of 1.6 times the TV height [15]. Accordingly, we set the viewing distance to be 1.6 times the TV height (74.8 cm), which was 110 cm.
The viewing room was illuminated to 250 lux, a common living room condition. We selected a highly dynamic sci-fi movie with saturated artificial colors that was also used in another part of our research aimed to define guidelines for the safety and assessment of content quality for realistic broadcasting (movie: Tears of steel, 2012, Blender Institute, Amsterdam, Netherlands).
Statistical analyses
All statistical analyses were performed using IBM SPSS Statistics ver. 22.0 (IBM Corp., Armonk, NY, USA). Subgroup analyses were conducted according to participant age (old age group >50 years vs. young age group ≤50 years) and dry-eye syndrome. The independent t-test and the chi-square test were used to compare baseline ocular indices between the groups. A comparison of the measured differences before and after watching the movie clip was examined by paired t-test. A linear mixed model was used to compare the index changes between the two groups before and after viewing. Pearson’s correlation coefficient was calculated to estimate the correlation between the changes in ocular indices and baseline ocular indices. A p-value <0.05 was considered statistically significant.
Results
A total of 76 subjects were divided into two groups according to the degree of TBUT (dry eye <8 seconds, nondry eye ≥8 seconds), and age (older age >50 years old, younger age ≤50 years), respectively. There was no significant difference in the demographics or baseline ocular indices between the dry-eye group and the non-dry-eye group. However, the proportions of female subjects and baseline ocular symptom scores were higher in the older group than in the younger group. Demographics and baseline ocular indices are summarized in Table 1.
Change in ocular indices after watching UHD TV
After watching the clip on UHD TV, mean TBUT for the total subject sample had significantly decreased by 1.1 second (p < 0.001) and mean corneal staining score had increased by 0.2 (p = 0.001). Other ocular indices (BCVA, refractive errors, conjunctival redness score, tear meniscus height and area measured by OCT, and ocular symptom score) did not significantly change after viewing.
In subgroup analyses exploring changes according to dry-eye syndrome, TBUT was unchanged in the dry-eye group (p = 0.726) but decreased by 2.5 seconds in the nondry-eye group (p <0.001). Corneal staining score increased by 0.2 (p = 0.003) and 0.14 (p = 0.048), respectively, in each group. The changes in ocular symptom scores before and after watching were not significant in either group according to paired t-tests. However, subjects had greater subjective discomfort in the dry-eye group compared with the non-dry-eye group (p = 0.046).
In the subgroup analyses of change based on age, TBUT had significantly decreased by 1.3 seconds in the older group (p = 0.010) and by 1.0 seconds in the younger group (p = 0.003). Corneal staining score increased in both age groups, but the amount of change in the older group (+0.21) was higher than that in the younger group (+0.15) (p = 0.038) (Table 2). The change in ocular symptom scores before and after viewing was not significant for either group, however, subjects in the older group had greater subjective discomfort compared with the younger group (p = 0.016). Other indices showed no significant change after viewing in either group.
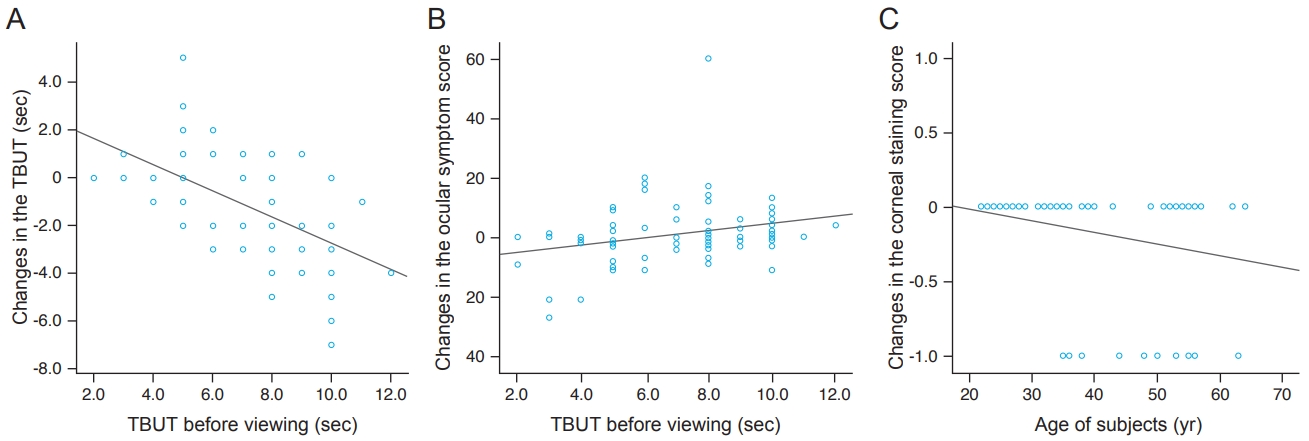
According to correlation analyses, decreased TBUT and ocular symptom score after watching UHD TV was significantly correlated with TBUT scores before watching UHD TV (p < 0.001, p = 0.017, respectively). Changes in corneal staining scores showed a positive correlation with age (p = 0.041) (Table 3 and Fig. 1).
Discussion
In this study, there were changes in mean TBUT and corneal staining scores after watching a 10-minute clip on UHD TV. First, mean TBUT decreased in the non-dry-eye group (9.01 ± 1.10 to 6.63 ± 1.91, p < 0.001), but not in the dry-eye group. After watching UHD TV, mean TBUT was shorter than 8 seconds, which met the criteria for dry-eye syndrome, which suggests that the dryness level on the ocular surface in the non-dry-eye subjects became similar to that of dry-eye subjects after watching UHD TVs. Second, corneal staining scores increased in both old and young subjects, but the differences were larger in the older group (p = 0.038). There was also a greater increase among older subjects in subjective discomfort after viewing compared with younger subjects (p = 0.016). Thus, we suggest that ocular fatigue induced by watching UHD TV, accompanied by surface epithelial defects, could be more severe in older subjects. Third, the decrease in TBUT correlated with an increase in subjective discomfort after watching UHD TV, according to participant responses on the ocular symptom questionnaire, indicating that people with dry-eye syndrome may suffer more subjective ocular fatigue and an increase in corneal epithelial defects after watching UHD TV.
Kwon et al. [8] performed an experimental study on 14 volunteers comparing ocular fatigue after watching 2D and 3D displays. They showed that subjective ocular fatigue (self-reported via questionnaire; score range, 0 to 60) increased by 3.57 after viewing 2D displays and by 7.65 after viewing 3D displays. Moreover, they found that TBUT decreased by 0.43 seconds after viewing both 2D and 3D displays and that conjunctival hyperemia (range, 1 to 10) increased by 0.29 and 0.21, respectively. Suh et al. [12] evaluated ocular fatigue after one hour of computer work in 15 volunteers. They found that ocular fatigue (self-reported via questionnaire; range, 0 to 60) significantly increased by 9.46 after computer work and TBUT decreased by 1.39 seconds; both results were statistically significant. They also found no difference in conjunctival hyperemia. Alhaag and Ramadan [16] reported that watching a 3D display at a 1.95-m distance caused significant visual fatigue, including eye symptoms, blurring, and headache. However, they did not measure objective parameters of the ocular surface such as TBUT or corneal staining. Chen et al. [17] reported that exposure to visual oscillation can cause nausea as well as motion sickness depending on the amplitude and velocity of visual motion.
It is difficult to directly compare these studies with our results due to the differences in viewing duration and in the type of displays employed in the study protocols. Nevertheless, previously reported results are consistent with our findings in that there was an increase in subjective ocular fatigue and a decrease in TBUT after viewing these UHD display systems. A particular strength of our study is the large sample size and our subgroup analyses by dry-eye syndrome and age, which revealed differences between these subgroups.
Mean tear meniscus height and area measured by anterior segment OCT were within normal range at baseline examination [18,19] and there was a positive correlation between tear meniscus height and area (r = 0.766, p <0.001). However, these variables did not change significantly after watching UHD TV in either the total or subgroup analyses. There was also no correlation between ocular indices at baseline measurements. Fukuda et al. [14] reported that tear meniscus height significantly correlated with the Schirmer test score, but not with TBUT, which is consistent with our results. This could be explained by the fact that TBUT reflects tear film stability, rather than tear fluid quantity. We did not perform the Schirmer test because it can cause irritation and reflex tearing, which could affect the measurements. Nevertheless, a possible correlation between tear meniscus height with subjective ocular symptom score cannot be excluded because tear meniscus height significantly correlates with the Schirmer test score [14], which, to date, has been widely used as a main ocular surface indicator (e.g., it is a diagnostic criterium for Sjögren’s syndrome). More reliable measurements could be achieved by measuring multiple points at close time intervals [20]. A comparison with the Schirmer score should be conducted in a future study.
Our study has a few limitations. First, the ocular symptom scores did not significantly change after watching UHD TV in the overall analyses. We used a relatively complex ocular symptom score [9], consisting of 10 questions with answers on a seven-point scale (0 to 6), to maximize the differences between before and after viewing UHD TV . However, several questions may have overlapped (i.e., “sore/aching eyes” and “irritated eyes,” “vision discomfort” and “difficulty focusing”), yielding duplicate responses. Second, 10 minutes of viewing may be too short to induce a measurable ocular discomfort. Seo et al. [11] reported that subjects started to feel definite ocular fatigue after 55 minutes of viewing 2D images. However, we did not identify a significant change in ocular discomfort in this study, despite significant changes in TBUT and corneal staining. This may indicate that objective changes, such as TBUT or corneal staining, may be antecedents to subjective discomfort. Conversely, subgroup analyses revealed that the older group and the dry-eye group showed greater tendencies toward subjective discomfort compared with the comparison groups. Third, we did not exclude systemic conditions that can affect ocular fatigue and dry eye, such as menopause [21]. Ocular fatigue is a complex and vague condition, and numerous factors may affect fatigue indices besides baseline characteristics and systemic conditions. Lastly, the percentage of female subjects and ocular symptom scores were significantly higher in the older group than the younger group. However, because there was no significant correlation between sex and baseline ocular indices, including TBUT and ocular symptom scores, even in the older group, a higher proportion of women may not have biased the results.
In summary, our study showed that objective ocular surface scores were not correlated with subjective ocular symptoms in a clear manner, but that tear break-up time and corneal staining scores changed even after a short period of UHD TV viewing. Hence, we presume that these indices reflect some portion of ocular fatigue after watching UHD TV. Moreover, we showed that the dryness of the ocular surface in non-dry-eye subjects may decline and become equal to that of dry-eye subjects after UHD TV viewing. Subjective ocular discomfort could increase in subjects over 50 years old or in people with dry-eye syndrome. Future studies are needed to further evaluate the criteria for viewing UHD TV, not only in healthy subjects, but also in children and people with specific eye diseases. Moreover, a comparative study is needed to evaluate whether ocular fatigue and surface changes after watching UHD TV differ between 2D or 3D images.
In conclusion, tear break-up time significantly decreases in non-dry eye subjects after watching UHD TV. Subjective ocular discomfort particularly increases in subjects over 50 or with dry-eye syndrome.
 PDF Links
 PubReader
 ePub Link
 Full text via DOI
 Full text via PMC
 Download Citation
 Print
Print