

Primary open-angle glaucoma is a chronic and progressive optic neuropathy that is accompanied by characteristic optic disc and retinal nerve fiber layer (RNFL) changes and associated visual field (VF) defects. Identifying the prognostic factors related to glaucoma progression will be critical for its prevention. Intraocular pressure (IOP) has been regarded as a key factor that accelerates the progression of primary open-angle glaucoma [1,2]. However, in populations where normal tension glaucoma (NTG) predominates, patients with a lower baseline IOP continue to progress despite consistently well-controlled IOP [3,4,5]. Hence, the identification of risk factors for progression in such NTG patients remains an issue to be resolved.
Another concern is how to define NTG. Conventionally, an IOP of less than 22 mmHg has been considered as the cut-off value for defining NTG. This cut-off value originated from the average and standard deviation (SD, 15.5 ┬▒ 2.6 mmHg) of IOP values obtained from previous studies [6] and has been widely accepted in clinical practice as well as in numerous publications, including large-scale randomized clinical trials such as the early manifest clinical trial [7]. In some East Asian countries, including Korea and Japan, 80% to 90% of primary open-angle glaucoma patients should be labeled as NTG according to the conventional cut-off value [8,9]. One possible explanation for this extremely higher percentage of NTG is that the normal IOP range may be lower in these countries. Some previous studies have supported this possibility. The mean IOP was reported as 15.3 to 15.5 mmHg in the Beaver Dam Eye Study, but was 14.5 to 14.6 mmHg in the Tajimi Study and 13.5 to 13.4 in the Namil Study [8,9,10]. Therefore, it may be prudent to shift the cut-off value for defining NTG according to the mean IOP in the relevant populations. In our present study, we applied two different cut-off values for defining NTG, including the conventional 21-mmHg value and the median IOP in our participants, and explored the characteristics of glaucoma progression when using these different criteria.
Materials and Methods
Participants
We performed a retrospective review of the medical records of all patients who were evaluated by a single glaucoma specialist (KRS) in the glaucoma clinic at Asan Medical Center (Seoul, Korea) from March 2008 to March 2015. Participants who met the inclusion criteria were consecutively enrolled. At the initial test, each participant received a comprehensive ophthalmological examination, including a review of their medical history, measurement of their best-corrected visual acuity, slit-lamp biomicroscopy, Goldmann applanation tonometry, gonioscopy, central corneal thickness (CCT) measurement (DGH-550 instrument; DGH Technology, Exton, PA, USA), dilated fundoscopic examination using a 90- or 78-diopter lens, stereoscopic optic disc photography, RNFL photography, a VF test, and spectral domain optical coherence tomography (SD-OCT). To be included in the study, participants had to meet the following criteria at their initial assessment: best-corrected visual acuity of 20 / 40 or better, the presence of a normal anterior chamber and an open-angle on slit-lamp and gonioscopic examinations, glaucomatous optic disc damage (the presence of focal thinning of the neuroretinal rim or notching and RNFL defects), and a glaucomatous VF defect. These findings were confirmed and agreed upon by two glaucoma specialists (KRS and JYL). Glaucomatous VF defects were defined as those with a cluster of three points with probabilities of less than 5% on the pattern deviation map in at least one hemifield, including at least one point with a probability of less than 1%; a cluster of two points with a probability of less than 1% and a glaucoma hemifield test result outside normal limits; or a pattern standard deviation outside 95% of the normal limits. We excluded participants with any other ophthalmic or neurological condition that could result in a VF defect or who had a history of diabetes mellitus. Eyes that had undergone intraocular or refractive surgeries were also excluded. If both eyes of the same patient were found to be eligible, one eye was randomly selected for analysis.
All of the participants with glaucoma in our present study were newly diagnosed cases and received follow-ups at 6-month intervals with stereoscopic optic disc photography, RNFL photography, VF testing, and SD-OCT scanning. All tests were performed at the same visit or within a 2-week period. To be included in the analyses, all participants were followed for at least 3 years. All patients underwent medical therapy during the follow-up periods. If the participant required intraocular surgery or laser therapy during the follow-up period, only data obtained before such operations were included. The institutional review board of the Asan Medical Center approved this study, and the study design followed the principles of the Declaration of Helsinki.
Visual field assessment
VF tests were performed using a Humphrey field analyzer (Swedish Interactive Threshold Algorithm 24-2; Carl Zeiss Meditec, Dublin, CA, USA). Only reliable VF test results (false-positive errors <15%, false-negative errors <15%, and fixation loss <20%) were included in the analysis. The VF test was repeated within 2 weeks of the baseline measurement for confirmation. Patients were expected to return approximately 1 month after the baseline exam to assess their response to the medication and to undergo a third VF test at that time. Thus, three total VF tests were performed within the first 6 weeks. The initial VF test data were excluded from the analysis to obviate any learning effect. Therefore, the second and third VF results, which were performed within 1 month, were incorporated into the analysis as baseline exams. For inclusion in the study cohort, at least five reliable VF tests (except for the initial VF) that were performed on separate visits were required. The VF progression was determined using commercial software (Humphrey Field Analyzer Guided Progression Analysis, Carl Zeiss Meditec) and was defined as a significant deterioration from the baseline pattern deviation at three or more test points that were evaluated on three consecutive examinations, or as a significantly negative slope (p < 0.05) in a linear regression analysis using the VF mean deviation (MD) data [11].
Optic disc and retinal nerve fiber layer assessment
The progression of the optic disc and the presence of any RNFL defects were determined through an evaluation of an entire series of stereoscopic optic disc and red-free RNFL photographs. Serial stereoscopic photographs were displayed on a liquid crystal display monitor. Two glaucoma experts (KRS and JYL) independently assessed all photographs to estimate the glaucoma progression. The most recent photograph was compared to the baseline photograph for each patient. The experts were not aware of each other's assessments and were also blind to all clinical, OCT, and VF information. Both evaluators reviewed all photographs for each eye before making an assessment and were asked to determine the glaucomatous optic disc or RNFL progression, as revealed by an increase in the extent of neuroretinal rim thinning, enhancement of disc excavation, and/or any widening or deepening or new appearance of an RNFL defect. Each grader classified each glaucomatous eye as either stable or progressing. If the RNFL photographs were difficult to evaluate due to the presence of diffuse atrophy or an invisible RNFL resulting from a lightly pigmented fundus, the progression was determined by an optic disc assessment. If the opinions of the two graders differed, that eye was excluded from the subsequent analysis.
Spectral domain optical coherence tomography assessment
SD-OCT images were obtained using a Cirrus HD-OCT system (Carl Zeiss Meditec). The image acquisition procedure has been described in detail elsewhere [12,13,14]. Our Cirrus HD-OCT system is regularly calibrated by a technician employed by the manufacturer. Circumpapillary RNFL (cRNFL) thicknesses were measured using the optic disc cube mode. Pupil dilatation was performed when necessary. All accepted images exhibited a centered optic disc or fovea, were well-focused with even and adequate illumination, exhibited no eye motion within the measurement circle, and had a signal strength of at least 7.
Statistical analyses
The eyes of the study participants were divided into the following two groups, according to the conventional cutoff value (21 mmHg) for the baseline IOP: the conventional high-tension glaucoma (cHTG) group (>21 mmHg) and the conventional NTG (cNTG) group (Ōēż21 mmHg). The same participants were classified into another two groups, according to the median value of the baseline IOP among our participants: the median HTG (mHTG) group (>15 mmHg) and the median NTG (mNTG) group (Ōēż15 mmHg). Baseline and follow-up data were compared between each NTG and HTG group using an independent t-test or chi-square test. Glaucomatous progression was defined based on two criteria: either serial optic disc/RNFL photographs or VF exams. We fitted univariate and multivariate Cox proportional hazard models to detect any associations between potential risk factors, including the category of refractive error, baseline untreated IOP and mean follow-up IOP, IOP fluctuation (SD of follow-up IOP measurements), CCT, baseline average cRNFL thickness, baseline VF MD, and glaucoma progression time based on two different criteria. Both univariate and multivariate analyses were performed separately for each group. Variables with a p-value less than or equal to 0.20 in the univariate analyses were included as candidate variables for the multivariate regression analysis. A backwards elimination process was used to develop the final multivariate model. Data are presented as adjusted hazard ratios (HRs) with 95% confidence intervals. The Schoenfeld residuals test was used to verify the proportional-hazards assumption; no violations were detected during this analysis. All statistical analyses were performed using the SPSS ver. 15.0 (SPSS Inc., Chicago, IL, USA).
Results
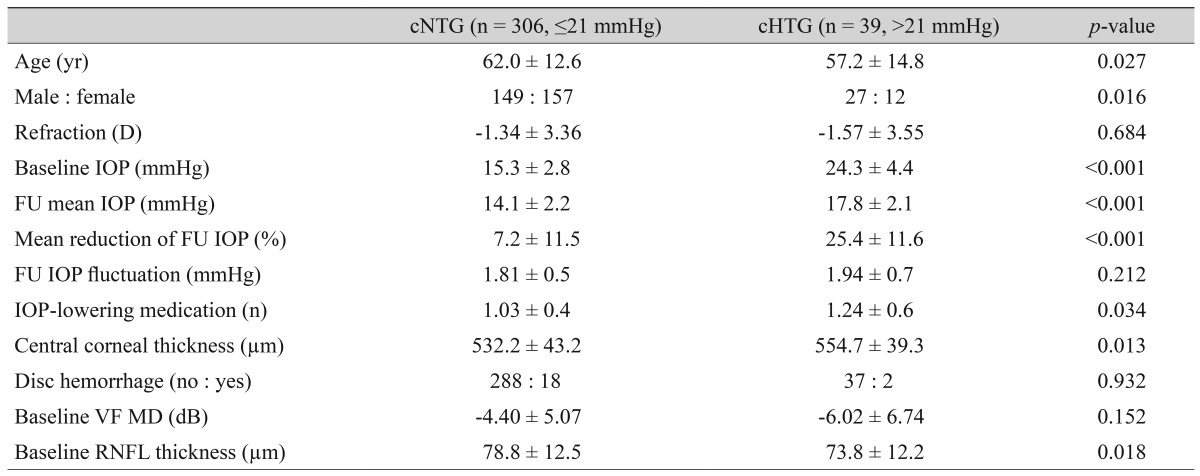
Our final analysis included 345 eyes from 345 patients (176 men and 169 women, all Koreans). Among these 345 participants, 201 had bilateral glaucoma. The mean follow-up period ┬▒ SD was 4.5 ┬▒ 1.0 years. Among these 345 eyes, 306 and 39 eyes were assigned to the cNTG and cHTG groups, respectively, according to conventional IOP cut-off criteria. Clinical characteristics were compared between the cNTG and cHTG groups (Table 1). As expected, the mean baseline IOP and follow-up IOP were significantly lower in the cNTG group, and the mean percentage of IOP reduction was also lower in the cNTG group. The mean CCT was lower in the cNTG group, while the occurrence of disc hemorrhage and baseline VF MD did not differ between the two groups.
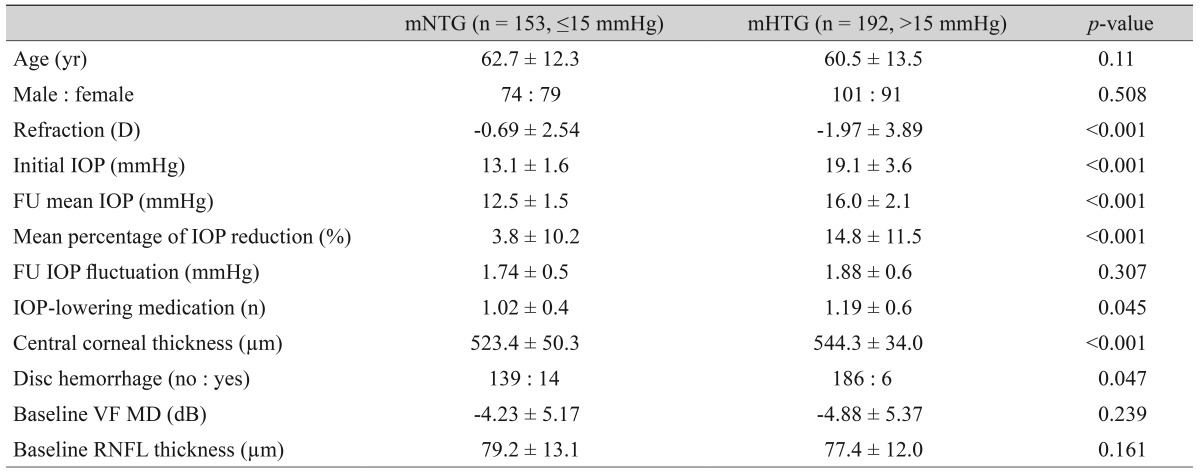
Simultaneously, 153 and 192 eyes were classified as mNTG and mHTG, respectively, using the median value of baseline untreated IOP (15 mmHg). Like the cNTG and cHTG groups, the mean baseline and follow-up IOP and percentage of IOP reduction were significantly different between the mNTG and mHTG groups. CCT was thinner in the mNTG group, while disc hemorrhage was more frequent in the mNTG group than in the mHTG group (Table 2).
Glaucoma progression was defined by either optic disc/RNFL photographic assessment or VF analysis. Among the 345 eyes in our current study series, 100 eyes (29.0%) showed progression on either optic disc/RNFL or VF examination, and the remaining 245 eyes (71.0%) remained stable during the follow-up period. Among the 39 eyes in the cHTG group, 11 eyes (28.2%) showed progression, while 89 of 306 eyes (29.1%) in the cNTG group progressed during the follow-up period. Progression occurred in either the optic disc/RNFL photographs or in the VFs during the same period in 44 of 153 eyes (28.5%) in the mNTG group and 56 of 192 eyes (29.2%) in the cHTG group.
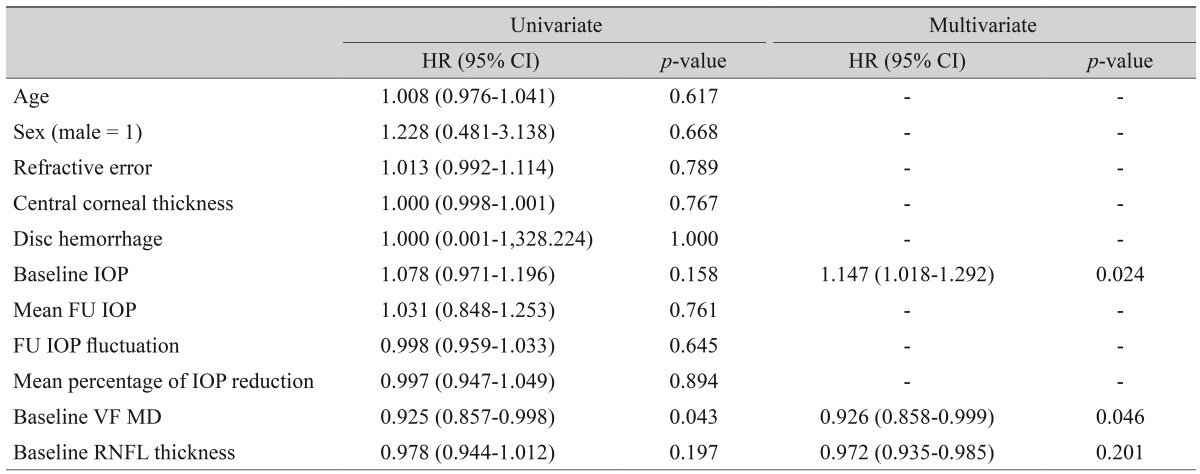
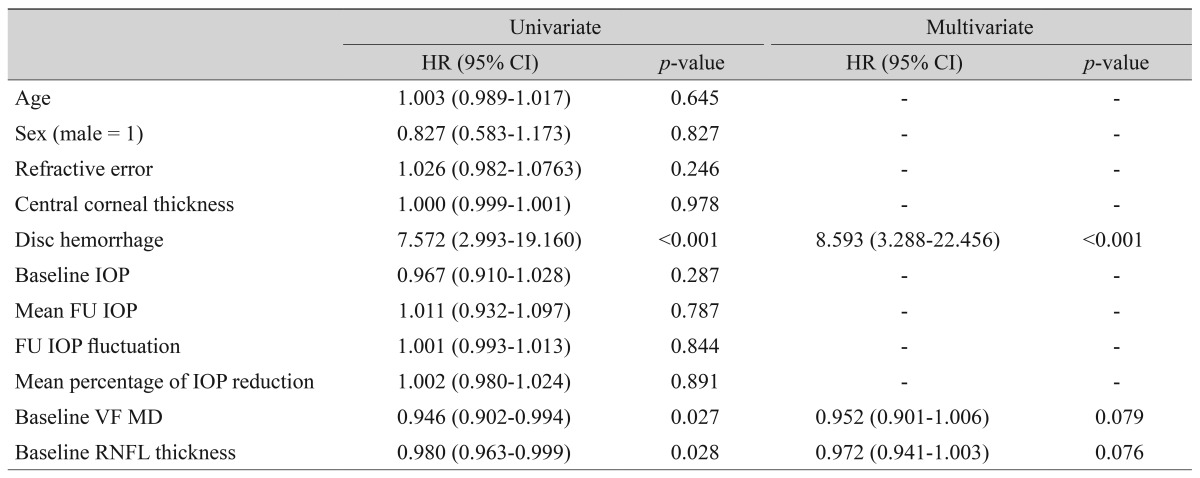
In the cHTG group, a higher baseline IOP (HR, 1.147; p = 0.024) and lower baseline VF MD (HR, 0.926; p = 0.046) were predictive of progression (Table 3). In the cNTG group, disc hemorrhage, baseline VF MD and cRNFL thickness revealed a significant association with glaucoma progression (Table 4). Both the mHTG and mNTG groups identified disc hemorrhage as a significant risk factor in multivariate analysis (Tables 5 and 6). Disc hemorrhage showed the strongest relationship with progression in the mNTG group (HR, 15.533; p < 0.001) (Table 6).
Discussion
According to our current results, only 10% of our total study participants were grouped as having HTG by the conventional IOP cut-off value, and the remaining majority was assigned to the NTG group. This result was in line with previous studies from Korea and Japan [8,9]. The median value of all participants was 16 mmHg. Hence, using a median split, approximately half of the total participants constituted both the mNTG and mHTG groups. Heijl et al. [7] previously adopted 21 mmHg as the cut-off value to define NTG and HTG because the median value of their participants was 21 mmHg in the early manifest clinical trial, which is similar to the conventional cut-off. However, our current study participants showed a much lower median value compared with that of the early manifest clinical trial.
The mean reduction in the follow-up IOP was lower in our cNTG group (7.2%), while our cHTG group obtained an IOP reduction of 24.3% after medical treatment. A lower IOP reduction after medical treatment was more evident in the mNTG group; the mNTG group showed only a 3.8% reduction in IOP, whilst the mHTG group achieved a mean IOP reduction of 14.8% after treatment. Notably, the mean number of IOP-lowering medications was slightly higher in both HTG groups. However, when we considered all eyes in both the cNTG and mNTG groups that had been treated with more than one medication, the level of IOP reduction in the NTG groups was marginal, especially in the mNTG group. At the same time, treatment is subject to modification by the progression rate of glaucoma in clinical practice. Considering that the overall prevalence of progression was not found to differ between the medically treated NTG and HTG groups, the NTG patients probably underwent a less stringent treatment than the HTG patients in terms of IOP control. In other words, our current findings may indicate that the NTG groups have a similar probability of progression compared with the HTG groups, along with a much lower level of IOP reduction.
Another finding in our comparative analyses of the NTG and HTG group characteristics was that the CCT was thinner in both the cNTG and mNTG groups. Hence, a lower CCT may contribute to some portion of the NTG patients who have an apparently lower baseline IOP. The prevalence of disc hemorrhage was not found to be different between the cNTG and cHTG groups but did show a difference in the mNTG versus mHTG comparison. This may be due to disc hemorrhage being more prevalent in eyes with a much lower baseline IOP. In other words, among the 20 eyes in our current series with disc hemorrhage, 14 were assigned to the mNTG group. Therefore, optic disc hemorrhage appeared to be a typical characteristic of patients with a lower IOP, even among the NTG patients that were defined by conventional criteria. This finding was also demonstrated in the factor analysis. Disc hemorrhage was observed to be strong risk factor in our mNTG group. Therefore, disc hemorrhage was related to the progression of glaucoma patients with an even lower baseline IOP among the NTG patients defined by the conventional cut-off value.
A higher baseline IOP was an indicator of significant risk for progression only in the cHTG group. A previous study also reported that a higher baseline IOP was associated with progression in NTG with a higher baseline IOP [15]. It was interesting that only 10% of our total participants showed a relationship with the baseline IOP and glaucoma progression. This result may be interpreted as an indication that non-IOP related factors are associated with progression in a substantial portion of NTG patients. However, since all of our participants underwent medical treatment, this finding should be interpreted with caution. The observation that IOP is not related to glaucoma progression does not necessarily mean progression is not accelerated through a pressure-dependent mechanism. Recent studies have reported that a thinner lamina cribrosa or lower cerebrospinal pressure is related to glaucoma progression, which may explain how the optic disc can be injured by IOP despite apparently lower IOP readings [16,17,18].
Our study had some limitations. This study was retrospective, and there is a possibility that the participants were treated with different degrees of aggressiveness with respect to their target pressures, as previously mentioned. In addition, the fact that IOP measurements were not performed by a single examiner and the diurnal variation in IOP was not considered should be acknowledged as other caveats. Furthermore, our study series was derived from a single ethnic group, and this fact should be considered in any interpretation of our results.
In conclusion, using the conventional cut-off value for defining NTG, only 10% of our total study participants were categorized as having HTG, and only in this group was the baseline IOP a significant risk factor for glaucoma progression. Disc hemorrhage was found to be a strong risk factor for progression in the NTG group classified using the median value, which implies that a cut-off value other than the conventional 21 mmHg is needed to define true low-tension glaucoma cases in countries such as Korea and Japan, where NTG predominates.


 PDF Links
 PubReader
 Full text via DOI
 Full text via PMC
 Download Citation
 Print
Print