

Cataract causes about half of the world's blindness cases, and the World Health Organization suggests an annual minimum target of at least 300 surgeries per 100,000 people [1,2]. However, the number of actual cataract surgeries varies according to socioeconomic status, healthcare infrastructure, demographics, and awareness of cataract level [3,4,5,6,7,8].
The number of cataract surgeries in general is rising due to an aging population, enhanced expectations among patients who want to live with better visual acuity, and advancements in medical technology [3,4,5,9,10,11]. Recently, the age of patients receiving cataract surgery has decreased, and the number of binocular cataract surgeries has increased [10,12].
Cataract can have a negative effect on quality of life and socioeconomic activities. It is therefore important to properly treat cataract and essential not only to understand the prevalence and awareness of cataract, but also to analyze the epidemiology of cataract surgery. We could not identify the actual occurrence of cataracts, but we could predict prevalence using data on the number of cataract patients and surgeries. We investigated time series changes in the number of cataract surgeries and the trends for whole age groups in the Korean population. There is no formal data on these topics, so our work provides basic knowledge to enhance medical services related to cataract surgery.
Materials and Methods
Ethics statement
This study was conducted with the approval of the institutional review board of Kosin University Gospel Hospital, South Korea (91961-ABG-15-017).
Data sources
We used data registered by the Korean National Health Insurance Service from January 1, 2006 to December 31, 2012 regarding major domestic surgeries performed and that were published by Statistics Korea. We specifically analyzed data on the number of cataract surgery patients during this time period, the number of cataract surgeries performed according to age and sex, the number of cataract surgery patients, and the number of cataract surgeries per 100,000 people. The categories of cataract surgery, according to Statistics Korea are pars plana lensectomy, intracapsular cataract extraction, extracapsular cataract extraction, phacoemulsification, primary intraocular lens implantation, after-cataract surgery, secondary intraocular lens implantation, and intraocular lens exchange.
Statistical analyses
All included patients underwent one of the cataract surgeries mentioned above. In cases where a patient received more than one cataract surgery within the same year, the total number of patients remained the same regardless of the numbers of operations, but the total number of operations increased. When a patient received more than two types of simultaneous cataract surgeries (for example, phacoemulsification with primary intraocular lens implantation), the number of operations was considered as one for statistical analysis. Population references for the number of patients per 100,000 people and the number of operations per 100,000 people were based on the total population receiving medical insurance coverage, including national health insurance and type-1 and type-2 recipients of National Basic Livelihood Security including phakia, pseudophakia, and aphakia cases. We organized patients into the following age groups: <1 year old, 1-4 years old, 5-9 years old, a group for every 5-year interval up to 85 years, and finally ≥85 years old.
We calculated the average number of patients and operations and the average number of patients and operations per 100,000 people over 7 years. To investigate the overall trend in cataract surgery frequency over 7 years, we analyzed the annual growth trend and identified age groups that accounted for the highest number of surgeries for each sex. From the total number of operations, we calculated the ratio of female-to-male cases. Using annual fluctuations, we sought to differentiate trends for female cases and trends for male cases. We also conducted analyses based on the number of operations per 100,000 people for each age group of women and men and noted any sex differences for each age group. To understand any age-related changes in cataract surgery cases, we compared the annual number of operations that occurred in 2007 or later with that of 2006 according to age group and then analyzed the trend for the age group with the highest increase rate. The ratio of the number of operations to the number of patients was calculated and analyzed by year to understand the trend of patients who received surgery at least twice in the same year.
Descriptive analyses to estimate the mean number of patients and the number of operations over 7 years, as well as the number of patients and operations per 100,000 people, were performed using PASW Statistics ver. 18.0 (SPSS Inc., Chicago, IL, USA). We conducted annual trend analyses with Spearman's rank correlation test. Annual changes in the female- to-male surgery ratio and the trend regarding the ratio of the number of operations to the number of patients receiving operations were estimated using Spearman's rank correlation test. For the trend of the age group to show the peak increase rate of operations compared to 2006 was analyzed using GraphPad Prism ver. 6 (GraphPad Software, San Diego, CA, USA).
Results
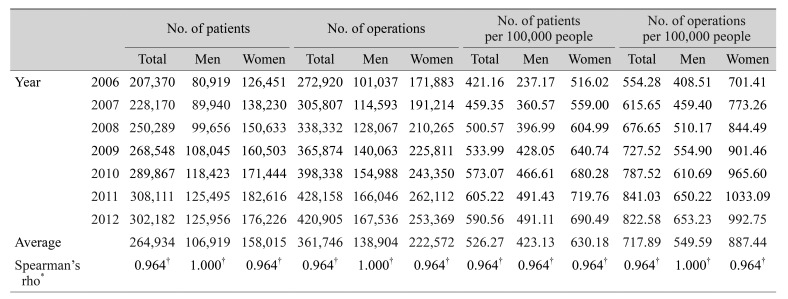
The average number of patients who underwent operation from 2006 to 2012 was 264,934 in the total population, with an average of 106,919 for men and 158,015 for women. The average number of operations over the 7 years was 138,904 for men and 222,572 for women. The average number of patients per 100,000 people over the 7 years was 423.13 for men and 630.18 for women. The average number of operations per 100,000 people over the 7 years was 549.59 for men and 887.44 for women. Over a 7-year period, there was a larger number of surgeries performed on female patients than male patients (Table 1). However, both sexes showed an increase over time in number of patients, number of operations, number of patients per 100,000 people, and number of operations per 100,000 people (p < 0.001).
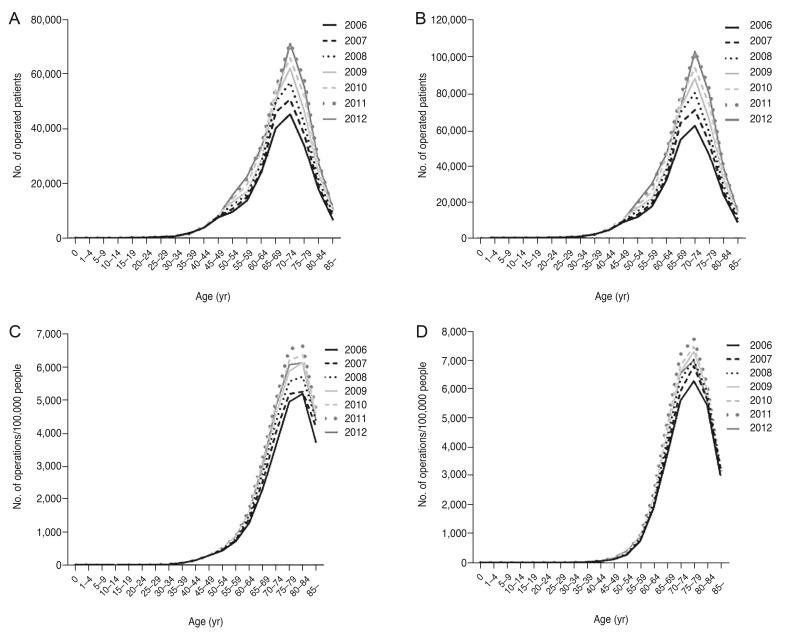
The peak age group of patients receiving surgery and of the total number of operations was 70- to 74-year-olds among both men and women, regardless of investigation year (Fig. 1A, 1B). For the number of operations per 100,000 people, the peak age groups were men 80- to 84-years-old and women 75- to 79-years-old (Fig. 1C, 1D).
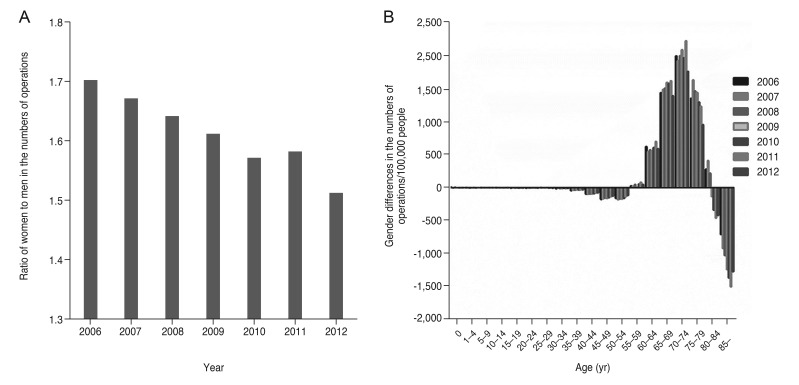
Considering the ratio of women-to-men cases in terms of number of operations, the absolute ratio of the number of operations was higher among women with a trend that declined each year from 1.70 in 2006 to 1.51 in 2012 (Spearman's rho = −0.964, p < 0.001). Additionally, women's share of the total number of operations decreased from 63.0% in 2006 to 60.2% in 2012 (Fig. 2A).
When we analyzed sex differences in terms of the number of operations per 100,000 people according to age group, men showed higher frequency among the 50- to 54-year-old group and among the ≥85-year-old group than women, and women showed higher frequency among the 55- to 79-year-old group than men, presenting a bimodal curve of sex difference (Fig. 2B).
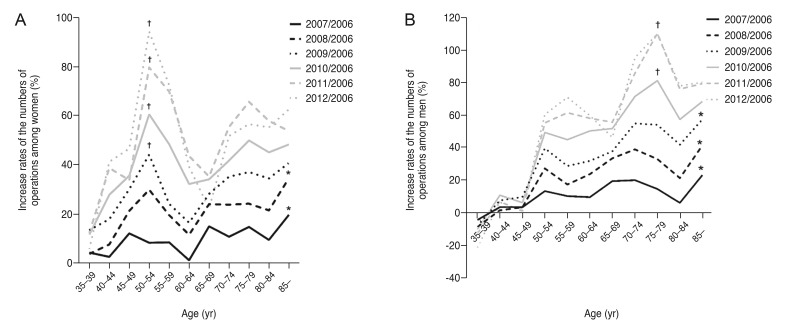
The increase rate of the annual number of operations among women from 2007 to 2012 compared to 2006 hit a peak in 2007 and 2008 among the >85-year-old group and from 2009 among the 50- to 54-year-old group, indicating that there was an increase in cataract surgeries among relatively younger age groups (Fig. 3A). For men, the increase rate peaked in 2007, 2008, and 2009 in the >85-year-old group and from 2010 in the 75- to 79-year-old group, similar to the pattern observed in women (Fig. 3B).
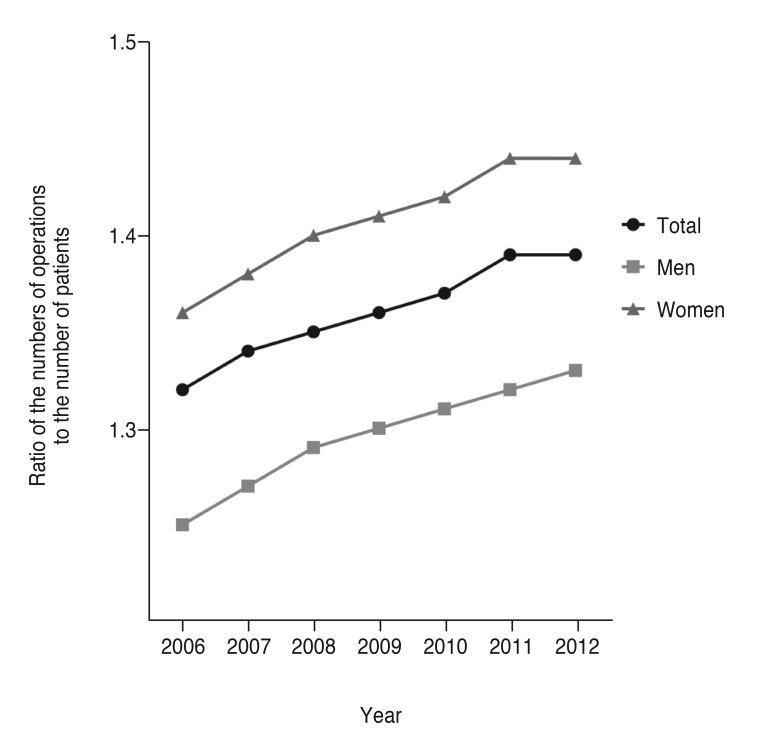
The number of operations was higher than the number of patients for both men and women across all study years. The ratio of the number of operations to the number of patients showed a continuous increasing trend, from 1.25 (men) and 1.36 (women) in 2006 to 1.33 (men) and 1.44 (women) in 2012, with the number higher among women than men (Spearman's rho = 1.000, p < 0.001) (Fig. 4).
Discussion
This study showed the rising trend of cataract surgery cases, with the total number of operations increased by 54% and the number of operations per 100,000 people increased by 48% from 2006 to 2012. This finding is primarily attributable to the absolute rise in the population requiring cataract surgery due to the aging population [4,5,13]. According to estimated population data by Statistics Korea, there was an increase of 4 million in the population of people >50 years old. In addition, changes in lifestyle expectations among older individuals could be driving the trend toward a larger number of cataract surgeries because older individuals are more likely than in the past to engage in social activities and live independently. Consequently, there is a greater demand for improved visual acuity and less tolerance for inconveniences to daily life. In a quality-of-life study using data from the 4th Korea National Health and Nutrition Examination Survey, Rim et al. [14] found that quality of life decreased in association with decrease in visual acuity. Cataract is associated with low visual acuity, and the desire to improve quality of life might have led to the observed increase in cataract surgeries.
Considering the sex proportion for number of operations, the absolute proportion was higher in women, although it trended down by year, from 63% in 2006 to 60% in 2012. In a Swedish study, no significant change was detected from 1992 to 2000 in terms of sex proportion for the number of cataract surgeries; however, the female proportion for the number of cataract surgeries decreased, similar to our study [4]. On the other hand, in the US Rochester Epidemiology Project study, the number of cataract surgeries for women significantly increased from 2005 to 2011, while that of men did not [5]. This result is different from ours and the Swedish study. Further study is needed to better understand the reasons for different sex and geography trends in the number of operations.
Our analyses also revealed the bimodal curve of sex difference in the number of operations per 100,000 people according to age. These differences might be due to the following reasons described in previous studies. First, the reason that men not more than 54 years old underwent a larger number of operations was that they were active socially and physically so that they had high frequency of traumatic cataract caused from ocular trauma. Song et al. found that men accounted for 87.9% of patients hospitalized for ocular trauma, with the prevalence peaking among men in their 20s and decreasing in the order of those in their 30s, 10s, and 40s [15]. They also found that cataract surgery was the most common type of secondary surgery needed to treat complications from ocular trauma. In an epidemiological study of ocular trauma from industrial accidents by Lee et al. [16], men were the majority of the study population (96.65%), and 20- to 50-year-olds represented 86.8% of male cases.
Second, anterior and posterior polar cataracts, which have a significant impact on visual acuity, require earlier cataract surgery and are more common in the relatively younger male group. This has resulted in more frequent cataract surgeries in younger men (≤54 years) compared to similarly aged women. Kim et al. [17] found that men made up 81.4% of anterior polar cataract cases, and 45.4% of these men were <40 years old. Kim and Joo [18] also reported that men predominated among cases of anterior polar cataract in Korea compared to other countries. Further studies are required to identify the factors that contribute to high prevalence among Korean young men with anterior polar cataract.
Third, patient awareness of cataract might contribute to the higher number of operations per 100,000 people among men aged ≥85 years than women. Based on the 4th Korea National Health and Nutrition Examination Survey data, Korean men had a lower awareness level than women about cataract [19]. Due to this, men were more likely to undergo surgery later than women, after they developed significant visual dysfunction and significant progression of the cataract.
Looking at the rate of increase in the number of operations per year by age group from 2007 compared to that of 2006, the peak age group of men decreased from 2010, and that of women decreased from 2009. This indicates that there was an increase in cataract surgeries among relatively younger groups. In this study, there was a limitation to accurately calculating the average age of the patients who underwent surgery. However, we indirectly assumed the lowering of patient average age based on the increased frequency of cataract-related surgeries in relatively younger groups. This trend is similar to that observed in the Swedish study, which also identified a trend in declining average patient age beginning in 2000 [4]. These results anticipate a continuous declining trend of average age in Korean cataract surgery cases in the future.
Throughout the observation period of this study, the total number of operations was consistently higher among both men and women than was the number of the patients who underwent operations. This suggests that some patients underwent at least two cataract-related surgeries. We assume that these must be the patients who underwent binocular cataract surgery or an additional surgery after development of postoperative complications in the same year. We cannot conclusively determine the cause, but considering reports from other countries [4,5,10,12], an increasing bilateral surgery rate or reduced interval between binocular surgeries is the likely cause.
This study has several limitations. First, the change in the number of cataract surgeries does not reflect a change in the actual prevalence of cataract. We estimated the incidence of actual cataract based on both the number of patients and the number of operations. Second, this study relied on data from Statistics Korea that were not subdivided by type of surgery, further limiting analysis. Thus, we could not determine whether the increase in the ratio of number of operations to number of patients was due to an increase in binocular surgery or an increase in secondary surgery due to complications. Third, the statistical data that we used were limited to sex and age, and further analysis of cataract surgery statistics could not be performed. Finally, we did not conduct analyses on trends in the number of operations according to patient motivation, i.e., whether the surgery was driven by patient factors like expectations for improved visual function, by introduction of new healthcare policies, or by factors associated with cataract surgery indications. Nevertheless, this study contains valuable data that can be used to develop medical systems providing high quality medical services for cataract based on surgery trends from a national-level health insurance database.
The frequency of cataract surgery has increased in Korea, and the absolute proportion of female cases was higher than male cases, while the proportion of male cases increased over the study period. In relatively younger groups, the number of operations increased over 7 years compared to 2006 in men and women, which suggests a decline in the average age of patients who underwent cataract surgery. The increasing ratio of number of operations to the number of patients during the study period can be presumed to be related to increasing bilateral surgery rates, based on previous reports [4,5,10,12]. Further ophthalmologist study of new medical technologies and development of healthcare policies related to cataract treatment are required to improve patient satisfaction and quality of medical services.
 PDF Links
 PubReader
 Full text via DOI
 Full text via PMC
 Download Citation
 Print
Print