

The choroid is the vascular layer that supplies the outer retina, ciliary body, and iris. Because part of the optic nerve head (ONH) is supplied by peripapillary choroidal circulation, the choroidal layer has been the focus of research on the pathogenesis of glaucoma [1,2]. The choroidal layer is invisible upon routine ophthalmoscopic examination because it lies beneath the retina. Choroidal circulation is usually assessed by angiography, such as fluorescein angiography or indocyanine green angiography. However, the structural features of the choroidal layer are usually inaccessible using established imaging devices.
Optical coherence tomography (OCT), an imaging technique used to observe the posterior segment of the eye, can provide high-resolution cross-sectional images of the retina and determine its in vivo status. However, the penetration of the OCT signal into deeper structures is limited; therefore, it is difficult to visualize deep-seated structures using OCT. Recent improvements in imaging technologies, including enhanced depth imaging (EDI), spectral domain (SD)-OCT, and sophisticated analysis techniques, enable clinicians to assess deeper structures such as the choroidal layer [3].
Choroidal thickness has already been assessed using SD-OCT and EDI in several studies [4,5,6,7,8,9,10,11]. However, the relationship between choroidal thickness and glaucoma is uncertain. Overall, macular choroidal thickness is not associated with glaucoma [4,7,9]. Studies assessing the relationship between peripapillary choroidal thickness (pCT) and glaucoma report conflicting results [8,10]. We believe that these differing results regarding the pCT are associated with various factors; thus, analytical results vary depending on the included factors. According to the previous studies, age and axial length (AXL) are consistently associated with pCT [3,4,7,11].
Using these known variables, we included other important factors in order to assess any relationship further. The lamina cribrosa (LC) is the primary site of glaucoma pathogenesis, and the blood supply of the LC is principally maintained by choroidal circulation [12]. Using SD-OCT and EDI technology, LC thickness (LCT) can also be determined [13,14,15,16]. Furthermore, the outer retinal layer is also supplied by choroidal circulation. We included both LCT and peripapillary outer retinal layer thickness (pORT) as covariates in the current study, and we evaluated the characteristics and factors associated with pCT.
Materials and Methods
All study subjects were prospectively and consecutively recruited from our glaucoma clinic and examined between February 2011 and November 2012. The healthy group consisted of staff, their family members, the spouses of patients, and volunteers from the eye clinic and hospital. The healthy group had no history of ocular symptoms or disease, or of intraocular incisional or laser surgery.
At the initial evaluation, all patients received a complete ophthalmologic examination that included the recording of medical, ocular, and family histories; visual acuity (VA) testing, Humphrey f ield analyzer (HFA) Swedish Interactive Threshold Algorithm 24-2 testing (Carl Zeiss Meditec, Dublin, CA, USA); multiple intraocular pressure (IOP) measurements using Goldmann applanation tonometry; stereoscopic optic disc photography; the determination of AXL (IOLMaster, Carl Zeiss Meditec) and central corneal thickness (CCT; DGH-1000 Ultrasonic Pachymeter, DGH Technology, Exton, PA, USA); and SD-OCT imaging (Spectralis; Heidelberg Engineering, Dossenheim, Germany).
For inclusion in this study, all participants had to meet the following criteria: best-corrected VA of 20 / 30 or better with a spherical refractive error within ±5 diopters (D) and cylinder correction within +3 D; normal anterior chamber and open-angle on slit-lamp and gonioscopic examinations, respectively; and reliable HFA test results with a false-positive error <15%, false-negative error <15%, and f ixation loss <20%. Subjects with any ophthalmic diseases that could result in HFA defects and those with a history of diabetes mellitus or intraocular surgery were excluded. One eye was randomly selected if both eyes were determined to be eligible. All healthy eyes demonstrated IOP values <22 mmHg with no history of IOP elevation and were normal upon visual field (VF) testing by HFA examinations. Glaucomatous eyes were defined as those with glaucomatous VF defects that were confirmed by two consecutive examinations that yielded reliable data, the presence of a glaucomatous optic disc that demonstrated increased cupping (vertical cup-disc ratio >0.6), a difference in the vertical cup-disc ratio of the eyes greater than 0.2, diffuse or focal neural rim thinning, or hemorrhage, as agreed upon by two glaucoma experts (KRS and JRL). Eyes with glaucomatous VF defects were defined as those with glaucoma hemifield test results outside normal limits or pattern standard deviations outside 95% of the normal limits. In addition, a cluster of three points with probability <5% on the pattern deviation map in at least one hemifield, including ≥1 point with probability <1% or a cluster of two points with probability <1%, was required. Glaucoma suspect (GS) eyes included those with a glaucomatous disc but normal VF. All glaucoma and GS patients were newly diagnosed and had not received glaucoma medications.
All procedures conformed to the Declaration of Helsinki, and all participants provided written informed consent. This study was approved by the institutional review board of Asan Medical Center, University of Ulsan, Seoul, Korea.
Spectral domain optical coherence tomography measurement and analysis
Only high-quality images were accepted. Such images were correctly focused, evenly illuminated, and centered on the optic disc. Using commercial software (Heidelberg Eye Explorer software ver. 1.7.0.0, Heidelberg Engineering), pORT (defined as the thickness between the posterior outer plexiform layer and the retinal pigment epithelium [RPE] interface) and pCT (defined as the thickness between the outer margin of the RPE and the choroidal-scleral interface) were manually measured by a single observer (HSC) using EDI scanning of the circumpapillary retinal nerve fiber layer (RNFL). All measurements were nasal, superior, temporal, or inferior (i.e., the four quadrants that were examined) to the disc and taken at the peripapillary region.
LCT was determined by a different observer (SK) using ONH scanning. Briefly, the entire ONH was scanned using a 6-mm line at 50-µm intervals (512 A-scans). In this study, a mean of 35 horizontal B-scans was produced in EDI mode for each patient. From these B-scans, three frames (center, mid-superior, and mid-inferior) that passed through the ONH were selected. LCT was defined as the distance between the anterior and posterior borders of the LC. The anterior and posterior borders of the LC were defined using a highly reflective structure below the optic cup. More detailed information is provided elsewhere [15].
The mean thickness of the peripapillary retinal nerve f iber layer (pRNFL) in each of the four quadrants (superior, inferior, nasal, and temporal) was provided by the manufacturer of the SD-OCT.
ANOVA (post hoc analysis, Tukey's test) was performed to compare the baseline characteristics and SD-OCT measurements of the three groups. Correlations between putative factors and pCT were determined in the glaucoma and healthy groups using univariate and multivariate linear regression analyses. Factors demonstrating p-values less than 0.2 by univariate analysis were incorporated into the multivariate analysis. Statistical analyses were performed using SPSS ver. 19.0 for Windows (IBM Corp., Armonk, NY, USA).
Results
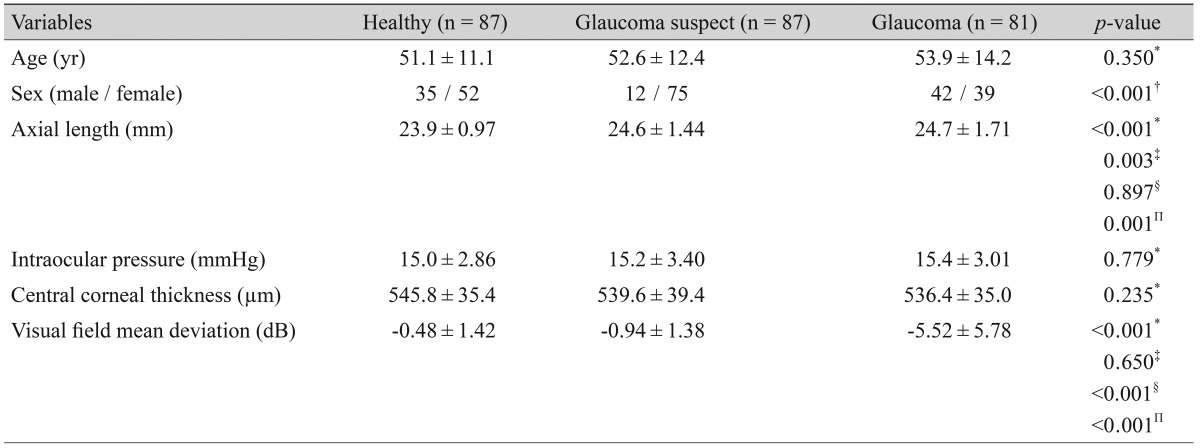
In total, 255 participants were included in the study (87 in the healthy group, 87 in the GS group, and 81 in the glaucoma group). The baseline characteristics of these participants are shown in Table 1. When comparing the characteristics and measurements of the three groups, there were no differences in terms of age, IOP, or CCT. The glaucoma group demonstrated significantly lower VF mean deviation values than the healthy and GS groups, as expected.
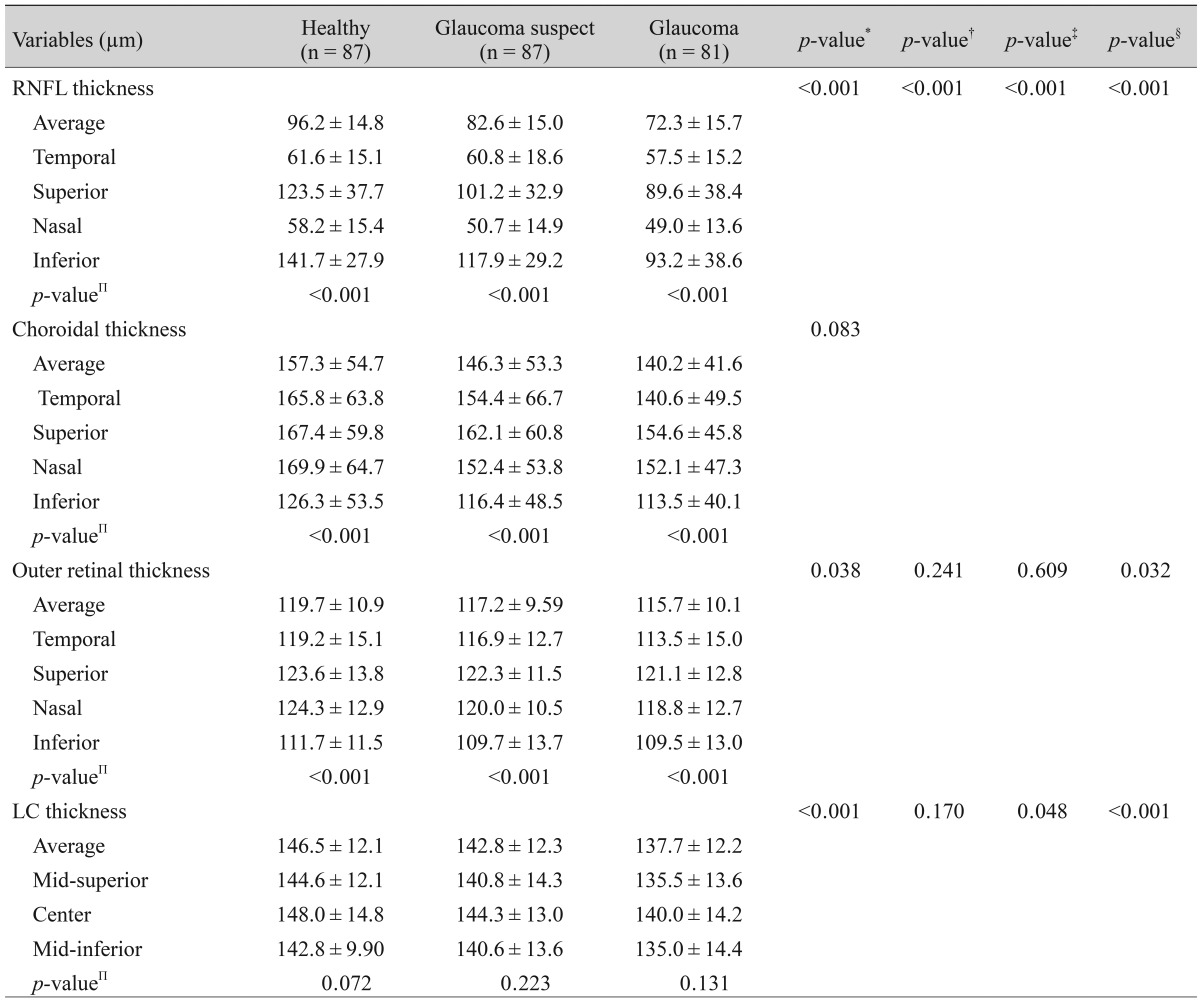
Table 2 presents the pRNFL thickness, pORT, and pCT values measured in the temporal, superior, nasal, and inferior quadrants relative to the optic disc and the LCT measured at the three areas of the ONH. In all three groups, both pORT and pCT were thinnest in the inferior area among the four quadrants which were assessed. In contrast, the pRNFL was thickest in the inferior area. In the healthy group, the mean pRNFL thickness, pORT, and LCT were signi cantly thicker in comparison with those of the GS and glaucoma groups (p < 0.001, p < 0.038, and p < 0.001, respectively). When we compared the GS and glaucoma groups, the pORT did not demonstrate any of significant differences (p = 0.609), but the LCT demonstrated a marginal difference (p = 0.048). The three groups did not demonstrate any of significant differences in the pCT (p = 0.083).
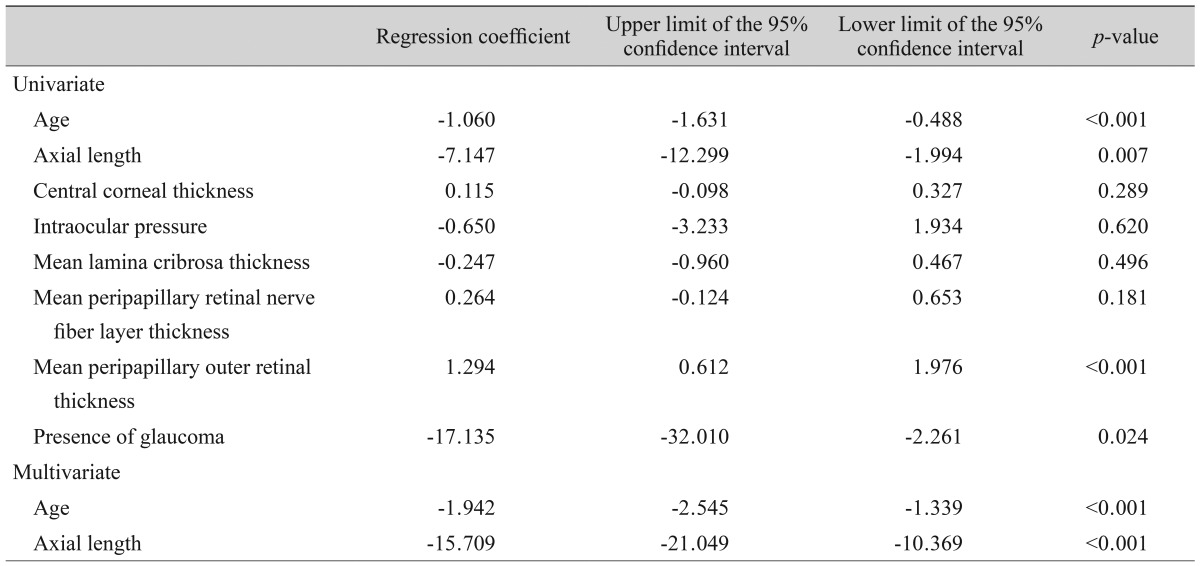
When assessed using univariate analysis, age, AXL, pORT, and glaucoma were associated with mean pCT, but LCT and pRNFL thickness were not associated with pCT. Only age and AXL were associated with pCT according to the multivariate analysis (Table 3).
Discussion
The majority of glaucoma patients in East Asian countries demonstrate a statistically normal range of IOP readings [17,18]. As described in Table 1, our GS and glaucoma participants also demonstrated no significant differences in terms of untreated baseline IOPs in comparison with the healthy group.
Therefore, various non-IOP-related factors have been investigated as possible contributors to the development of glaucoma [19,20]. One such factor is related to ischemia. Because ONH is partially supplied by the choroidal circulation, the choroidal layer has typically been the focus in this context.
As expected, the GS and glaucoma groups demonstrated thinner pRNFL thicknesses than the healthy group; the GS and glaucoma groups also demonstrated a significant difference in terms of pRNFL thickness. In addition, pORT was thinner among the patients in the glaucoma group. Since pORT has not been measured in glaucomatous eyes in the previous studies, we could not compare these results to other study outcomes. Glaucoma is essentially a disease of the inner retina that is characterized by the reduction of the inner retinal layer, which includes the ganglion cell layer and RNFL [21,22,23,24,25,26]. Therefore, our finding needs to be further investigated in future studies.
Our study results indicated that there were no significant differences in pCT values between the three groups. Previously, pCT was reported to be thinner in a group of highly myopic normal-tension glaucoma patients, but another study indicated that pCT was not associated with glaucoma [8,10]. The LC was thinner in the GS and glaucoma groups than in the healthy group in our current study, which coincides with the previous observation [13].
An interesting finding is that both pCT and pORT were significantly thinner in the inferior quadrant; in particular, pCT was substantially thinner in the inferior quadrant. This finding was consistent across all three groups. In general, the inferior RNFL was the thickest among the four quadrants, and the inferior RNFL is the area most vulnerable to glaucomatous damage. In other words, early glaucomatous changes frequently present as a reduction in the thickness of the inferior RNFL [27]. This vulnerability of the inferior RNFL has been explained by the findings that the LC of the inferior pole has larger pores and thinner connective tissue and glial support for passing retinal ganglion cell axons [28,29,30]. The observations that the LC is supplied by the choroidal layer, the choroidal layer is the thinnest in the inferior area, and that the LC is the weakest at the inferior area are interesting. These findings might be related to each other; however, this speculation needs to be investigated in future studies.
Our univariate analysis, which investigated the correlation between putative factors and pCT, demonstrated that age, AXL, pORT, and the presence of glaucoma were associated with mean pCT. According to our multivariate analysis, only age and AXL were associated with pCT. As previously mentioned, age and AXL have been consistently associated with pCT in previous studies [3,4,7,11]. The finding that pORT and the presence of glaucoma were associated with pCT-at least according to the univariate analysis, but not the multivariate one-may be explained by these covariates interacting with age and AXL.
According to our results, LCT was not associated with pCT. Because OCT uses a light source that cannot penetrate the neuroretinal rim, the full features of the LC, including the superior and inferior poles, were not efficiently visualized. Thus,the current assessment of LCT is limited to the relatively central area of the LC. This limitation in the estimation of the pole area may affect clinical outcomes.
Our study has another limitation. Although choroidal thickness demonstrates good reproducibility in well-controlled studies [5,6], its measurement may be variable to some degree because the choroid is essentially vasculature. Some studies report circadian variability in choroidal thickness (CT) measurements [31,32,33,34]. Therefore, the variability of CT measurements may affect the outcome of CT studies including ours. Conflicting results among studies may stem from the measurement variability of CT.
In conclusion, pCT was substantially thinner in the inferior area of the ONH. In addition, pCT demonstrated a strong correlation with age and AXL, but was not associated with the presence of either glaucoma or LCT in our analysis.
 PDF Links
 PubReader
 Full text via DOI
 Full text via PMC
 Download Citation
 Print
Print